9 Trade policy
In this chapter, we discuss countries’ incentives and opportunities to influence trade flows and the welfare implications of trade policy. In particular, we provide information on how the World Trade Organization organizes the world trading system.
9.1 Globalization
The term “globalization” is often used in different contexts and is usually implicitly associated with diverse and sometimes contradictory ideas about how the world works. There is no clear and generally accepted definition of the term. The use of the term carries a high risk of being misunderstood, as the conversation partner may have a different understanding of the term.
Nevertheless, it is important to understand the various meanings of the term to be able to understand the arguments that involve the term. Additionally, it allows you to phrase your own argument more precisely.
So, how can we get known to the various meanings of the term globalization. One way is to ask ChatGPT. Below you find my take on asking OpenAI (2024).
Discuss: What do people mean when they use the term “globalization”? NextGeneration:AI
Globalization is a multifaceted concept that refers to the increasing interconnectedness and interdependence of countries and cultures around the world. When people use the term “globalization,” they often mean several interrelated processes:
Economic Globalization: This aspect emphasizes the integration of national economies through trade, investment, and capital flows. It involves the reduction of trade barriers, the rise of multinational corporations, and the spread of global supply chains. Economic globalization has led to increased access to goods, services, and jobs across borders.
Cultural Globalization: This involves the sharing and blending of cultural elements such as language, traditions, music, and values. Through media, travel, and technology, cultural practices and ideas can spread more freely, leading to both cultural exchange and homogenization. It raises discussions around the preservation of local cultures versus the influence of dominant global cultures.
Political Globalization: This refers to the increasing influence of international institutions and agreements, such as the United Nations, the World Bank, and trade treaties. It encompasses the idea of global governance and the shared responsibility of nations to address global challenges like climate change, human rights, and security.
Technological Globalization: This highlights the role of technology in fostering globalization. Advances in communication, transportation, and information technology have made it easier for people and businesses to connect globally. The internet, for example, enables instantaneous communication and the transfer of information across borders.
Social Globalization: This aspect focuses on the movements of people around the world, including migration, tourism, and the exchange of ideas and social practices. It emphasizes how global interactions affect societal structures and relationships.
Environmental Globalization: This addresses the global nature of environmental issues, such as climate change and biodiversity loss, which require international collaboration and efforts to manage resources sustainably.
Critically, globalization is also a subject of debate and contention. Advocates argue that it can lead to economic growth, cultural exchange, and improved living standards. Critics, however, point to issues such as economic inequality, cultural erosion, and exploitation as consequences of globalization. Additionally, events like the COVID-19 pandemic have sparked discussions about the vulnerabilities and risks associated with a highly interconnected world.
Overall, globalization encompasses a broad range of interactions and dependencies that shape contemporary society, economy, and culture on a global scale.
9.2 Political arguments for trade restrictions
Like most things in real life, trade is never all good or all evil. There are arguments in favor of opening up foreign markets and promoting international cooperation, but there are also plausible arguments that justify restricting international trade. Very often it is an empirical question as to which line of argumentation dominates.
When politicians and interest groups debate the pros and cons of trade, we must be aware of the unfortunate circumstance that not everything that is plausible is logically correct or empirically dominant. Below I will discuss some plausible arguments in favor of trade restrictions. The list is incomplete. Each argument is a topic in itself, and it needs to be further investigated whether these arguments are really valid arguments in favor of trade restrictions.
9.2.1 The desire to reduce domestic unemployment
As we learned in the previous sections, the domestic production is the result of the world market price in the long-run. However, in the short run this means that production factors need to reallocate from one sector to the other. So far, we assumed that this reallocation happens without any frictions. Thus, we just moved along the PPF curve. In reality the transformation process is costly because the people loose their jobs without finding a job in another sector instantaneously without any costs. In reality a transformation process comes along with costs such as social costs and search and matching costs. Thus, it can be a rational strategy to decrease the reallocation/transformation pressure in order to organize the reallocation of productions factors properly holding the external negative effects of transformation low. Nevertheless, we should not forget that (in the long run) reallocation of production factors and the adaption of new technologies is basically one of the most important sources of welfare growth, if not the only source.
9.2.2 The key enabling technology argument
If domestic industries are fostered, there might be technological spillovers to other industries in the country. As the government internalizes these spillovers, they have an incentive to protect and support these key to growth industries and technologies, respectively.
9.2.3 The need to counteract dumping in international trade
Selling goods in a foreign market below the price charged domestically can be called dumping. This sort of price competition is harmful when foreign producers hamper competition and discourage innovation and upgrading. For example, predatory dumping can give arguments for anti-dumping policy interventions. Predatory dumping is a type of anti-competitive behavior in which a foreign company prices its products below market value in an attempt to drive out domestic competition. This may lead to conditions where the company has a monopoly in a certain product or industry in the targeted market with bad implications for social welfare.
9.2.4 The government revenue argument
Government can finance their budget by raising tariffs.
9.2.5 The national defense argument
National defense is an obviously legitimate goal for any sovereign government and hence, domestic industries that supply goods and services that are important for a potential military emergency should have a special protection.
9.2.6 The wish to decrease the national balance of payments deficit
Countries that have a large trade deficit wish – for whatever reason (see Chapter 3}) – to increase import restrictions in order to decrease the export deficit.
9.2.7 The income redistribution argument
As we have learned, trade generates winners and losers and hence is a source for the distribution of wealth. Government can use this knowledge to redistribute income or decrease income inequality. However, it is almost certain that this politic is not the most efficient and best way to achieve the said goals because we have also learned that trade is beneficial for a country as a whole.
9.2.8 The infant industry argument
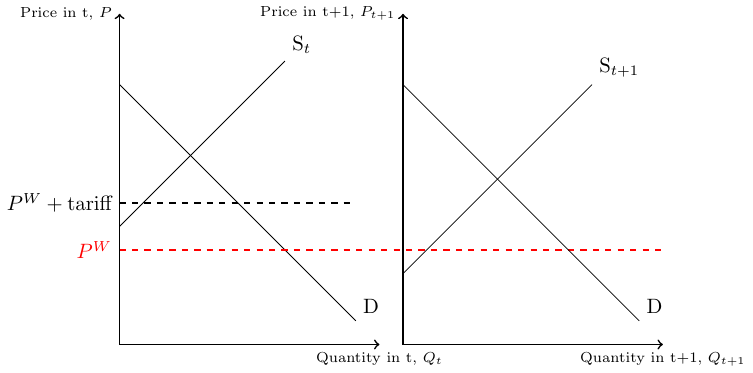
The basic idea is that no economic activities will happen in industries in which there are no possibilities to make positive profits because competition from abroad is currently to strong. A finite protection from international competition can make firms to grow and become more productive so that they can face foreign competition after the protection is abolished. The core of the argument is that infant industries do not have economies of scale like competitors from abroad and, hence, need to be protected until they can attain similar economies of scale.
Figure 9.1 provides a visualization that may help to understand the infant industry argument. In the left panel you see that the domestic supply curve lies above the world market price, \(P^W\). Thus, the domestic industry is not competitive enough to produce at costs lower than the world market price. A tariff in time \(t\) would protect the domestic market so that some firms start to produce and sell their goods at home. The hope of the government now is that the firms become more productive over time and in turn their supply curve shifts downwards. The downward shifted supply curve in time \(t+1\) is shown in the right panel. Here, the government can remove the tariff without crowding out the domestic production.
Exercise 9.2 Buy local be happy?

In many countries, including the U.S. (see Figure 9.2), people tend to believe that it is better to buy at home than abroad. A Statement of The White House on July 28, 2021 says:
“The President believes that when we spend American taxpayers’ dollars, it should support American workers and businesses. In his first week in office, President Biden signed Executive Order 14005, Ensuring the Future is Made in All of America by All of America’s Workers, launching a whole-of-government initiative to strengthen the use of federal procurement to support American manufacturing.’’
There are intuitive reasons to think that way. However, there are also some logical and persuasive arguments that confront that point of view. Please read the following quotes and discuss whether or not buying locally can be a welfare-enhancing strategy.
The first excerpt is entitled with 15 Reasons to Buy American Made Products and stems from www.buydirectusa.com:
Next time you are in a store or shopping online look for the Made in USA label. The job you save by doing so could one day be your own!
When you buy American products you support American workers. Existing jobs are saved and more employment opportunities are created.
When you buy American Made products you support companies that are doing business in America.
Hundreds of major American corporations are continuing to ship thousands of jobs overseas. Displacing the American worker.
Since 2000. the United States has lost an incredible 32% of its manufacturing jobs.
To prevent more of our manufacturing cities all over America from being transformed from thriving communities into crime infested hellholes. What happened to Flint, MI and Camden, NJ can happen in any American city when corporations decide to move production overseas.
China is now the number one supplier of components that are critical to the operation of US defense systems. Does this bother anyone else?
According to the Economic Policy Institute The economy has been unable to create jobs due to America’s massive trade deficit.
U.S. trade policies encourage businesses to relocate production of goods to other nations without penalizing them for selling those goods back to the United States. This has resulted in millions of lost jobs for the American people.
Since 1975, the US has imported more goods than it has exported. In 2010, the US had a deficit of $478 billion in global trade.
Over 30 years of trade policies such as NAFTA and CAFTA have taken jobs from the American people.
For every $1 billion in goods imported, the economy loses 9,000 jobs.
No regulation or safety standards in products made overseas. Chinese-made drywall used in US homes is creating health and safety hazards.
Moral implications of the exploitation of foreign workers and violations of child labor laws overseas.
Environmental standards are minimal or non existent in how products are made overseas. This has an impact on everyone on the planet.
Chinese imports accounted for more than 60% of the recalls announced by the Consumer Product Safety Commission in 2007
UPDATE
COVID – Where did that get released from?
When you buy products from the CCP, you are helping to fund their military which are a growing threat around the globe.
You don’t have to swim to get the products you need.
The second quote stems from Federal Reserve Bank of Dallas (2002, p. 16) who try to de-mystify the intuition of the buy local propagandists using a lot of data and some logical arguments of which you can read one here:
“A common myth is that it’s better for Americans to spend their money at home than abroad. The best way to expose the fallacy in this argument is to take it to its logical extreme. If it’s better for me to spend my money here than abroad, then it’s even better to buy in Texas than in New York, better yet to buy in Dallas than in Houston… in my own neighborhood… within my own family… to consume only what I can produce. Alone and poor.”
9.3 Stylized facts on trade openness
While often mentioned in the academic literature and heavily discussed in politics, the term trade openness lacks an accepted definition. Mostly it refers to the outward or inward orientation of a given country’s economy and touches many things including some measureable indicators such as
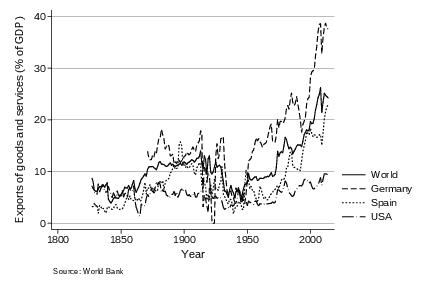
- Volume of trade: the sum of exports and/or imports (see Figure 9.3)
- Trade openness: trade to GDP ratio (see Figure 9.4, and Figure 9.5)
- Trade policy regime: tariff profile, border efficiency, …
- Openness to FDI: FDI inflow to GDP, ease of doing business
- Infrastructure: logistics performance, communications infrastructure, telephone lines, Internet
- Political regime: stability, democratic, open minded, reliable, …
Source: WTO
9.4 Trade anecdotes
9.4.1 The Regional Comprehensive Economic Partnership (RCEP)
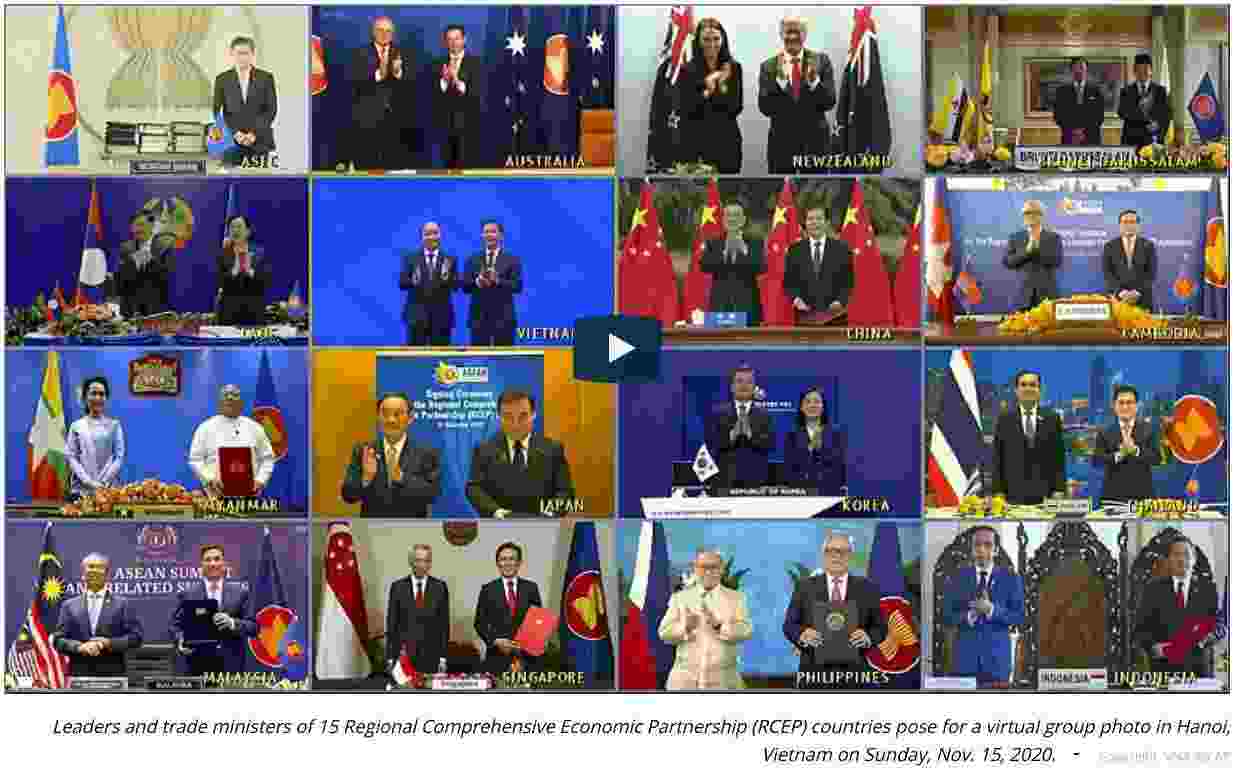
The leaders of China and another 14 countries in the Asia-Pacific region (see Figure 9.9) have signed one of the biggest free trade deals in history, covering 2.2 billion people and 30% of the world’s economic output. The deal will cover nearly 28% of global trade.
The Regional Comprehensive Economic Partnership (RCEP) was signed over a video link on November 15th after eight years of negotiations.
The deal sets the terms of trade in goods and services, cross-border investment and new rules for increasingly important areas such as electronic commerce and intellectual property. The effect on the trade of finished goods between Asian nations will be particularly marked, analysts have said.
Trade and investment flows within Asia have vastly expanded over the past decade, a trend that has accelerated amid feuding between the US and China, in which the two superpowers have imposed billions of dollars’ worth of punitive tariffs on each other’s exports.
Unlike the CPTPP – the Comprehensive and Progressive Agreement for Trans-Pacific Partnership – and the EU, it does not establish unified standards on labor and the environment or commit countries to open services and other vulnerable areas of their economies.
Donald Trump in 2017 pulled out of the Trans-Pacific Partnership, a deal previously envisaged as a way of curbing China’s influence.
9.4.2 Trade dispute between the USA and the European Union
In June 2018, the U.S. government imposed tariffs on € 6.4 billion worth of European steel and aluminum exports, followed by additional tariffs in January 2020 affecting approximately € 40 million worth of EU exports of certain steel and aluminum derivatives. The EU imposed countervailing measures on € 2.8 billion worth of U.S. exports to the EU in June 2018 (a similar EU response followed the second set of U.S. tariffs in 2020). The remaining countervailing measures, affecting up to € 3.6 billion worth of exports, were scheduled to take effect on June 1, 2021. The EU suspended these measures until December 1, 2021, to allow the parties to work together on a longer-term solution. Following today’s announcement by the U.S., these measures will not be imposed. (see European Commission, 2021)
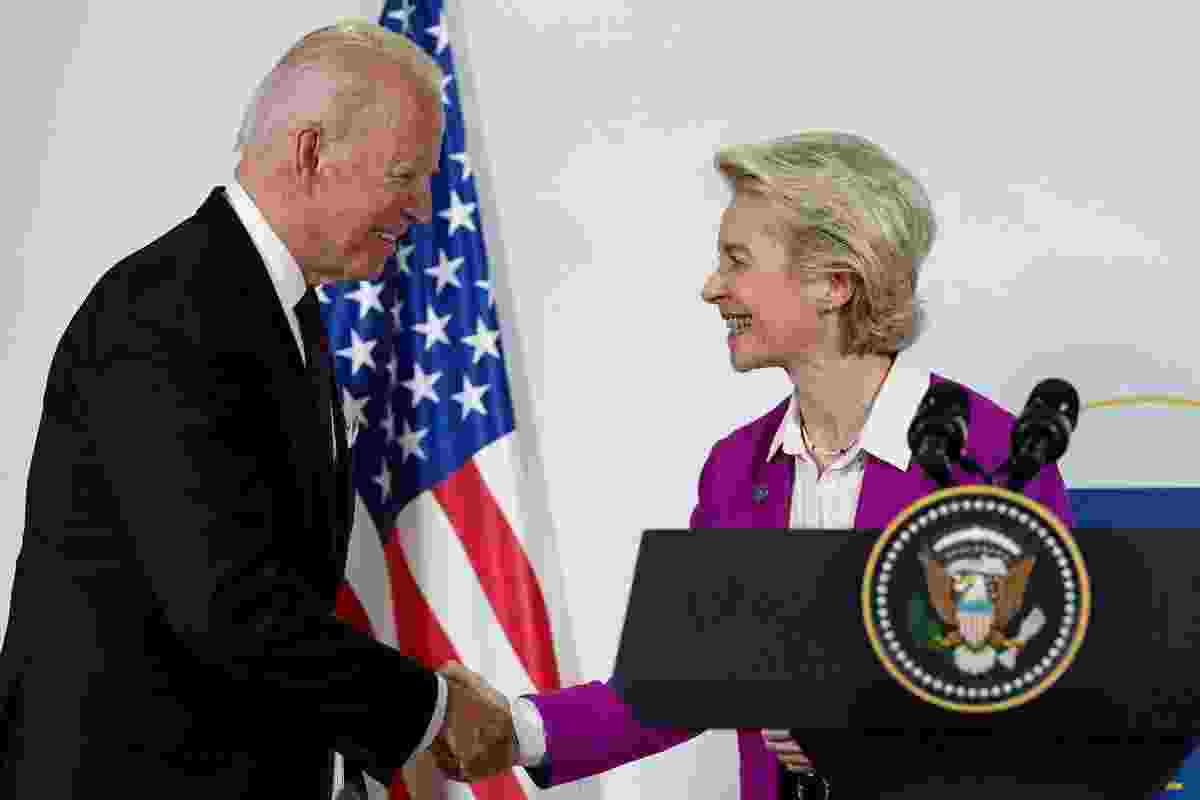
Source: REUTERS/Kevin Lamarque
In November 2021, President Biden has signed a deal to end tariffs on steel imports from the EU, which were imposed by his predecessor Donald Trump. But the agreement does not cover exports from the UK, putting British steelmakers at a disadvantage as is discussed in an article of the BBC, see UK steel makers ‘left behind’ as US ends trade war.
9.4.3 Boeing vs. Airbus
Boeing has continually protested over launch aid in the form of credits to Airbus, while Airbus has argued that Boeing receives illegal subsidies through military and research contracts and tax breaks. All that yielded litigation at the WTO and a series of decisions that allowed (trade) penalties of both sides.
For example, on 2 October 2019, the WTO approved US tariffs on $7.5 billion worth of European goods, and officially authorized them on 14 October, despite the European Union urging for a negotiated settlement. On 30 September 2020, however, the WTO approved the European Union’s retaliatory tariffs on $4.1 billion worth of US goods, this is in addition to the previous unimplemented sanction allowing the EU the right to impose tariffs of up to $8.2 billion on US goods and services
This is a trade war where nobody will probably be better of in the end. For more details on this dispute, I recommend reading the Wikipedia entry.
On June 15, 2021, the U.S. and the EU achieved a major breakthrough in the trade dispute between Boeing and Airbus, agreeing to end the 17-year dispute. All tariffs were suspended for five years.
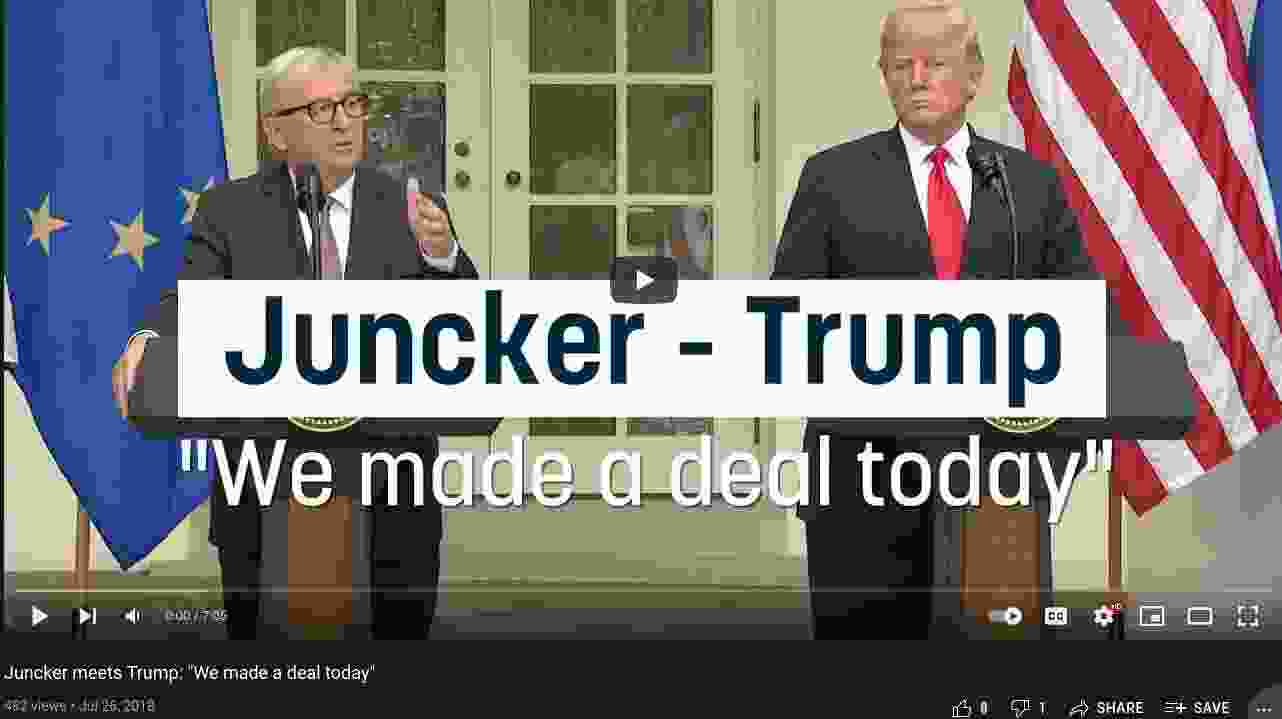
9.4.4 Trump vs. the European Union (a.k.a. Jean-Claude Juncker)
Under president Trump, United States imposed tariffs on goods such as cars, olives, single malt whiskey, pecorino cheese, and wine. The EU, in turn, has raised tariffs on goods such as orange juice, bourbon, peanut butter, power boats, and Harley-Davidson motorcycles. This escalation was brought to a halt on July 25, 2020, Jean-Claude Junker and Donald J. Trump met at the White House to discuss the ongoing trade dispute, see Figure 9.11. They announced that the United States and the European Union would work to reduce tensions created by Trump’s confrontational trade policies in the past. Before that meeting they made their standpoints clear as paraphrased below.
9.4.5 Trump and his trade war with China
Donald J. Trump said in his 2016 presidential campaign, see time.com:
“We allowed foreign countries to subsidize their goods, devalue their currencies, violate their agreements and cheat in every way imaginable, and our politicians did nothing about it. Trillions of our dollars and millions of our jobs flowed overseas as a result. I have visited cities and towns across this country where one-third or even half of manufacturing jobs have been wiped out in the last 20 years. Today, we import nearly $800 billion more in goods than we export. We can’t continue to do that. This is not some natural disaster, it’s a political and politician-made disaster. Very simple. And it can be corrected and we can correct it fast when we have people with the right thinking. Right up here. […] To understand why trade reform creates jobs, and it creates a lot of them, we need to understand how all nations grow and prosper. Massive trade deficits subtract directly from our gross domestic product. From 1947 to 2001, a span of over five decades, our inflation-adjusted Gross Domestic Product grew at a rate of 3.5 percent. However, since 2002, the year after we fully opened our markets to Chinese imports, the GDP growth rate has been cut in half. [] A Trump administration will change our failed trade policies, and I mean quickly.”
I don’t want to go into details about the trade disputes of China and USA. A concise and continually revised overview is offered by Wikipedia.
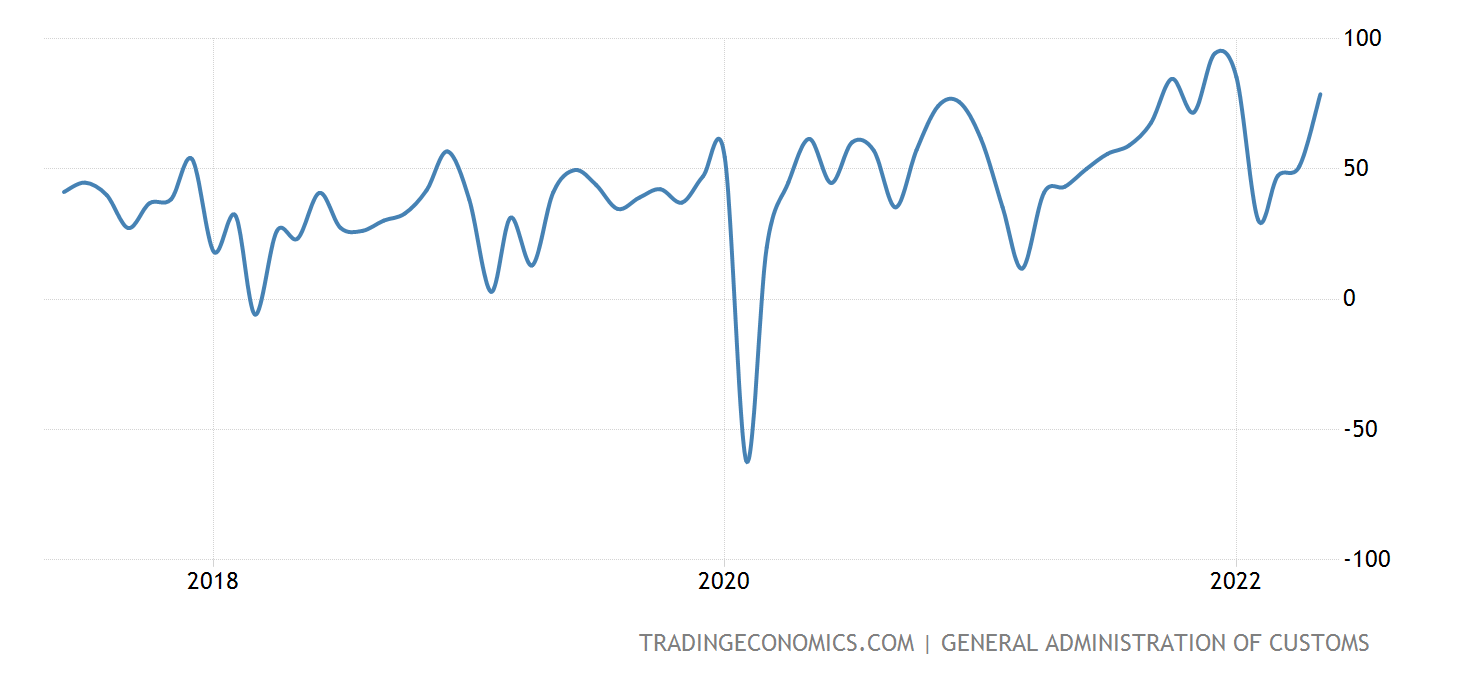
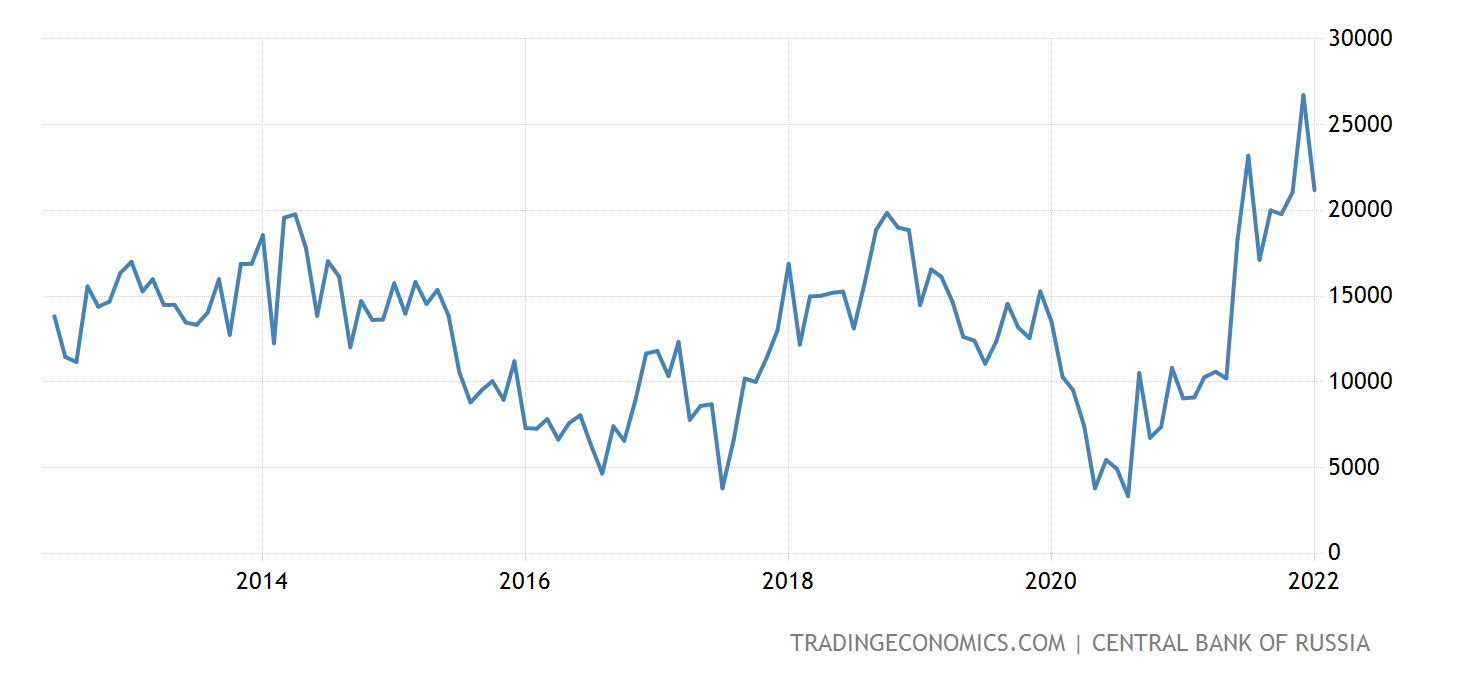
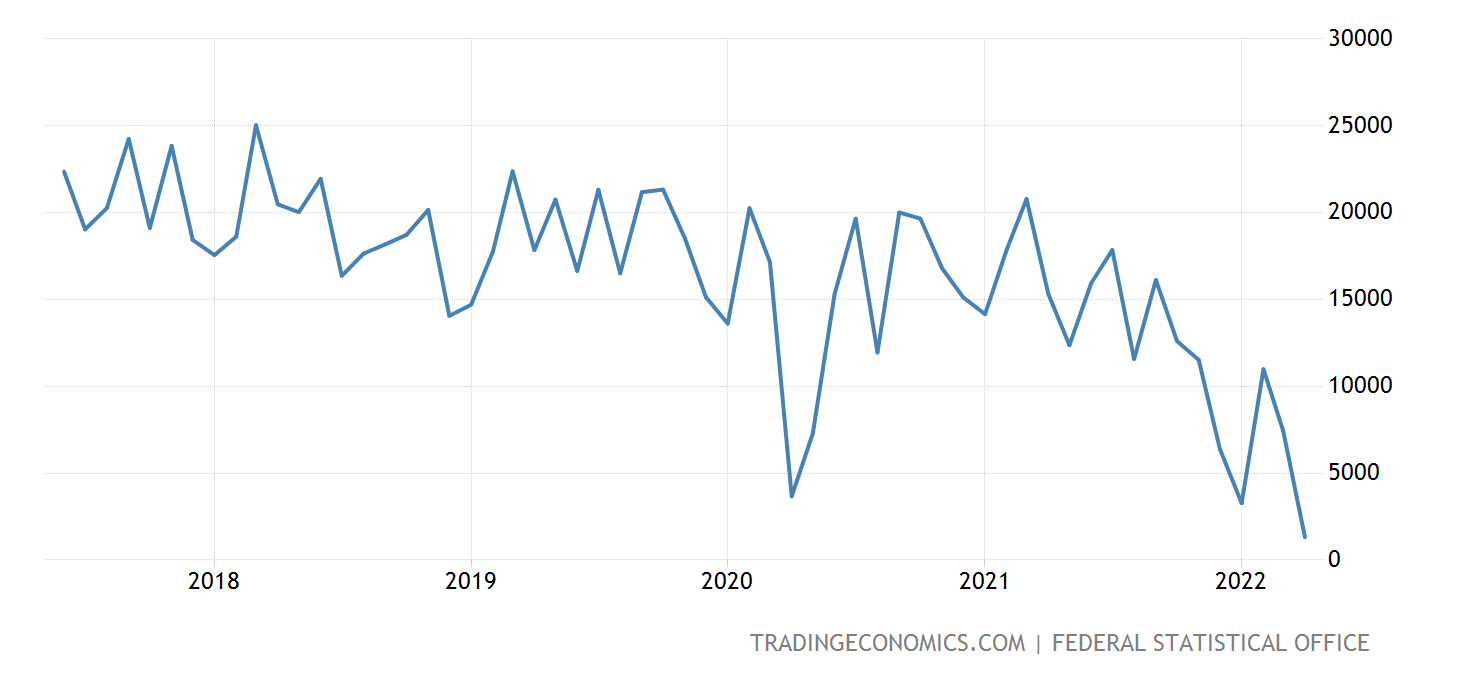
The following charts show the trade surplus/deficit (exports minus imports) for the USA, China, Russia, and Germany. The data were downloaded on 15th of June 2022 from tradingeconomics.com.
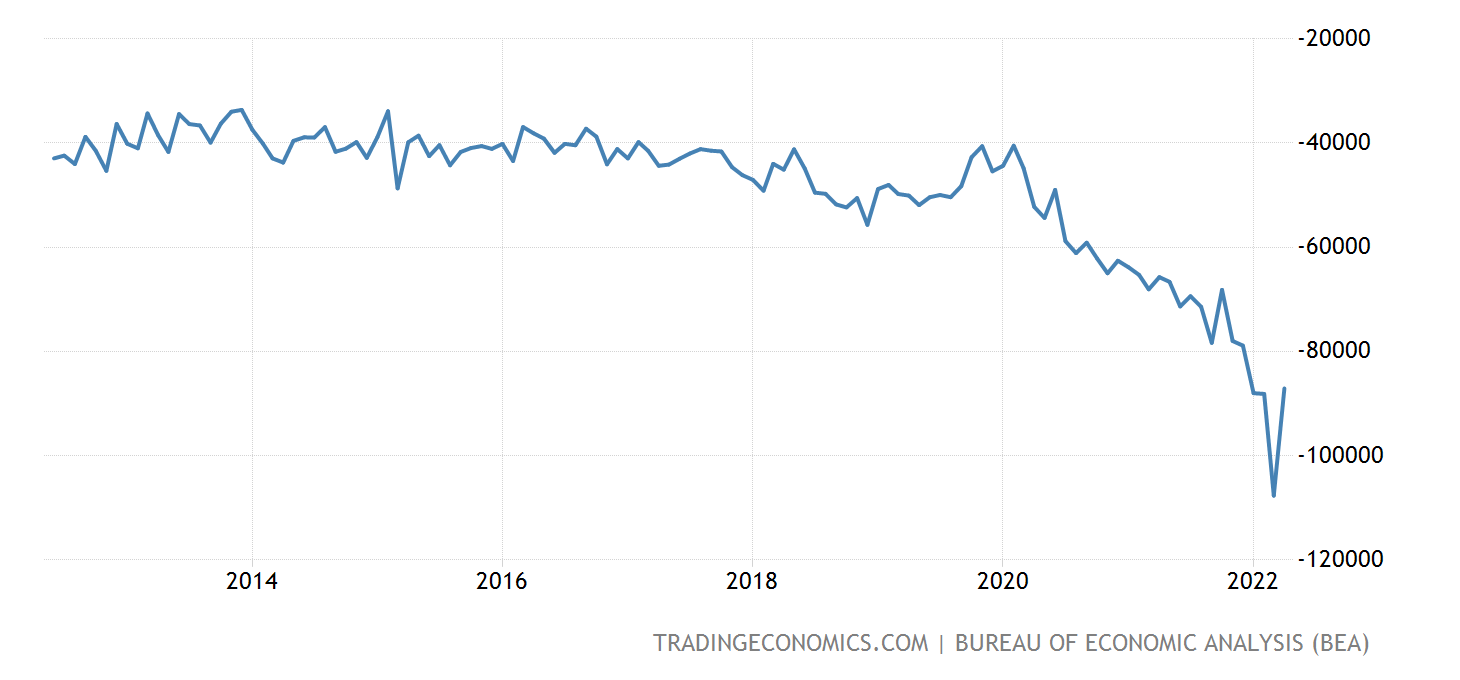
Figure 9.12 indicates that Trump was not successful in reducing the trade deficit. Overall, it seems to be the case that trade wars are not that easy to win as he claimed. It is rather difficult to impact the trade deficit within some years. Moreover, it is almost impossible to create more jobs that are lost and boost the economy with starting trade disputes.
For those who are interested: Here is a well researched article about that topic by Ryan Hass and Abraham Denmark, entitled More pain than gain: How the US-China trade war hurt America.
Exercise 9.3 Balance of payments across countries
Figure 9.13 shows the balance of trade over time for China, Russia, and Germany. Discuss the impact of COVID-19 on the balance of payments over time across the three countries.
9.5 Gains from trade
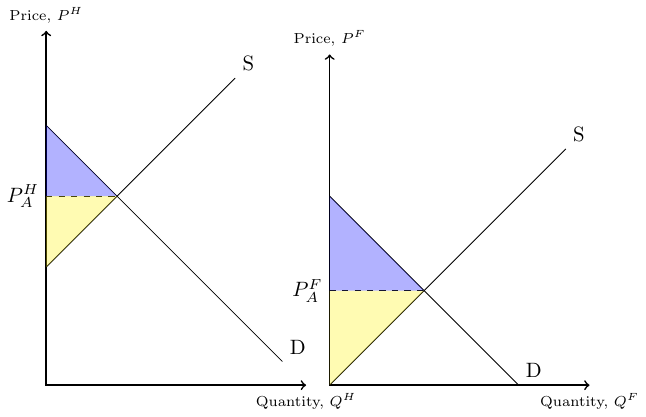
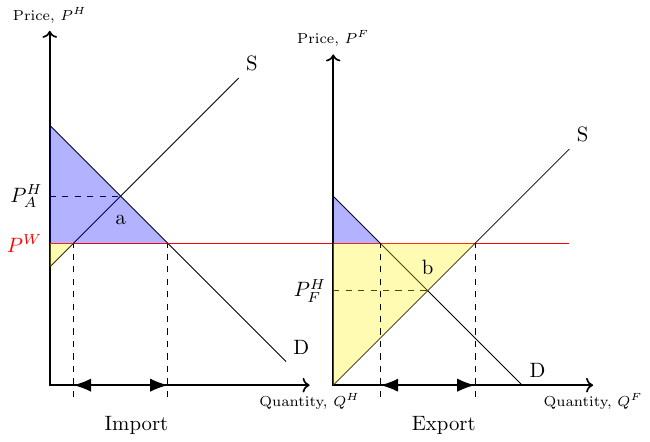
Figure 9.14 and Figure 9.15 contain domestic supply and demand curves. In autarky with no possibilities to trade, supply and demand must meet. Under free trade and a given world market price, \(P^W\), countries can trade with each other. This has implications for the producer surplus (yellow area) and the consumer surplus (blue area), as shown in the figures. The area of the triangles a and b as denoted in Figure 9.15 represents the welfare gain from free trade that can be achieved given the world market price, \(P^W\).
9.6 Tariffs in small open economies
Figure 9.16 can teach us a lot about the impact of a tariff \(t\) on trade and welfare. A tariff raises the domestic price of imported goods. If we assume that the imposition or change of a country’s tariff has no effect on the world price, we consider what is called a small open economy, which is so small that the country’s consumption and production decisions do not affect the world price. In other words, the country takes the world price for granted because its import demand does not change the world price.
In autarky, the economy represented in Figure 9.16 would consume 5 units at price \(P^A\). Under free trade without tariffs, the country imports 8 units and consumes 9 units at the price of \(P^W\). The consumer surplus corresponds to areas \(a+b_2+d_1+c+d_2\) and the producer surplus corresponds to area \(b_1\). After the introduction of tariff \(t\), the consumer surplus is equal to area \(a\) and the producer surplus is equal to area \(b_1+b_2\). Thus, consumer surplus has decreased while producer surplus has increased. The area \(c\) is equal to the government’s revenue. It represents the portion of the consumer welfare loss that is transferred to the government. Overall, welfare has decreased. The welfare loss is equal to the areas of the two triangles \(d_1\) and \(d_2\). These triangles represent what is called the deadweight loss due to the tariff.
Specifically, triangle \(d_1\) represents the reduction in imports that is replaced by domestic production, and triangle \(d_2\) represents the loss in consumption due to a reduction in imports and a reduction in domestic consumption.
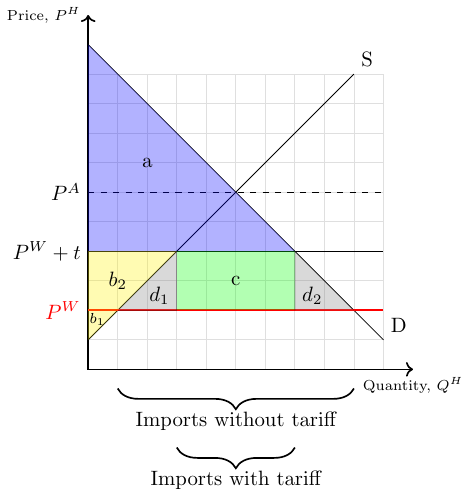
While a tariff protects domestic producers and increases their surplus, it reduces the surplus of consumers and leads to a deadweight loss of revenue. Overall, a tariff leads to a reduction in a country’s welfare.
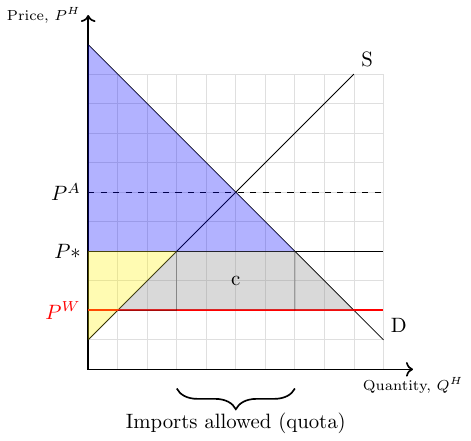
9.7 Quotas in small open economies
A trade restriction that sets a physical limit on the quantity of a good to be imported is called an import quota. It gives government officials more power and control than a tariff because they can strictly limit the quantity of goods traded and have the administrative authority to grant (or sell) import licenses to certain foreign exporters.
Figure 9.17 shows the impact of an import quota that allows an import quantity of 4 units. In this scenario, 7 units are consumed, four of which are imported. The price at which all seven units are consumed is \(P*\). This is somewhat surprising because the world price \(P^W\) is less than \(P^*\). The reason is that all firms that are allowed to sell their products do so at the highest possible price, that is, \(P^*\). As above, the blue area is the consumer surplus and the yellow area is the producer surplus. The gray area is the loss in value due to the import rate. The rectangle \(c\) is only part of this loss, since we assume that the government does not sell the licenses to the best bidding exporting firm
9.8 Tariffs in large open economies
So far, we have assumed that the country of interest is small and takes the world market price as given. However, large countries’ demand for imported goods can have an impact on world prices. If this is the case, we can show that a tariff can actually improve a country’s welfare. Figure 9.18 illustrates the effects of a tariff on welfare, prices, and trade. In particular, we show the impact of a small tariff of 6 euros per bicycle.
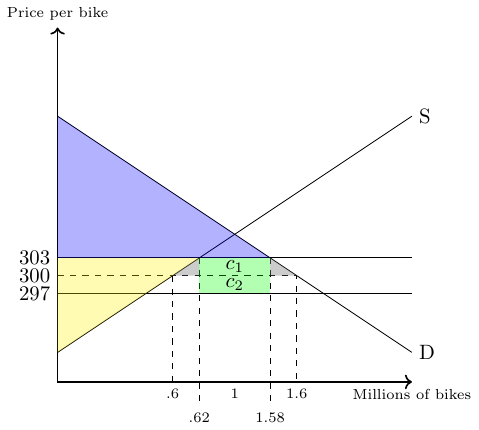
Under free trade, the market for bicycle imports is cleared at a price of €300 and the country imports one million bicycles.
Now, if a tariff of 6€ per bicycle is imposed, the tariff drives a wedge between the price foreign exporters receive and the price domestic buyers of imports pay. That is, it becomes more expensive for domestic buyers to purchase imported bicycles. This, in turn, leads to an immediate drop in domestic demand for bicycles and pushes the world market price for bicycles to €297 Given the new world market price for bicycles, the domestic price for imported bicycles is €303 (297+6).
The consumer surplus is now represented by the blue area and the producer surplus by the yellow area. The green area represents the tariff revenue collected by the government. The two gray triangles, in turn, show the tariff-related deadweight losses. Compared to the free trade scenario, the country gains rectangle \(c_2\). If the revenue in this area is greater than the deadweight loss, the country has improved its overall welfare by imposing a tariff.
Let us calculate whether this is the case here:
- Area \(c_2\): \[ (1.58 \text{ million bikes} - 0.62 \text{ million bikes})\cdot (\text{€} 300-\text{€} 297)=\text{€} 2.88 \text{ million} \]
- Deadweight loss: \[\begin{align} \underbrace{\frac{(0.62 \text{ mio b.}-0.6 \text{ mio b.})\cdot (\text{€} 303 - \text{€} 300)}{2}}_{\text{left triangle}} + \\ \underbrace{\frac{(1.6 \text{ mio b.}-1.58 \text{ mio b.})\cdot (\text{€} 303 - \text{€} 300)}{2}}_{\text{right triangle}}\\ =\text{€} 0.06 \text{ million} \end{align}\]
- Indeed, the net gain is €2.82 million. Thus, a small tariff can increase the welfare of a country.
9.9 Other nontariff trade barriers
In addition to tariffs, there are a variety of other trade barriers. These so-called non-tariff barriers (NTBs) include quotas, export subsidies, domestic production subsidies, government buy-at-home policies, and product standards. Here is a more complete list:
- Import quotas
- Voluntary export restraints
- Antidumping laws
- Exchange-rate controls
- Countervailing duties
- Government subsidies
- Licensing, labeling and packaging restrictions
- Quality controls and technical standards
- Domestic-content laws
- Political rhetoric
- Embargoes and sanctions
- Most/least-favored nation status
For example, product standards are much more important than you might think. For example, no car from the United States can be sold in the European Union without modifications because our safety standards are different. Another example is the CE marking (see below). Harmonization of product standards is usually an important issue in trade agreements.

The CE marking shown in Figure 9.19 is one example for a non tariff trade barrier. It is not an abbreviation for China Export, as many believe. While CE is sometimes indicated as an abbreviation of Conformite Europeenne (French for European Conformity), it is not defined as such in the relevant legislation. The mark indicates that the product may be sold freely in any part of the European Economic Area, irrespective of its country of origin. The CE marking is a declaration by the manufacturer (not by some authority!) that the product complies with EU standards for health, safety and environmental protection for products sold within the European Economic Area (EEA). Thus, it is not a quality indicator or a certification mark and may also be found on products sold outside the EEA. You may also know the _FCC Declaration of Conformity} which is used for selling certain electronic devices in the United States.
Exercise 9.6 Tariff (Solution 9.2)
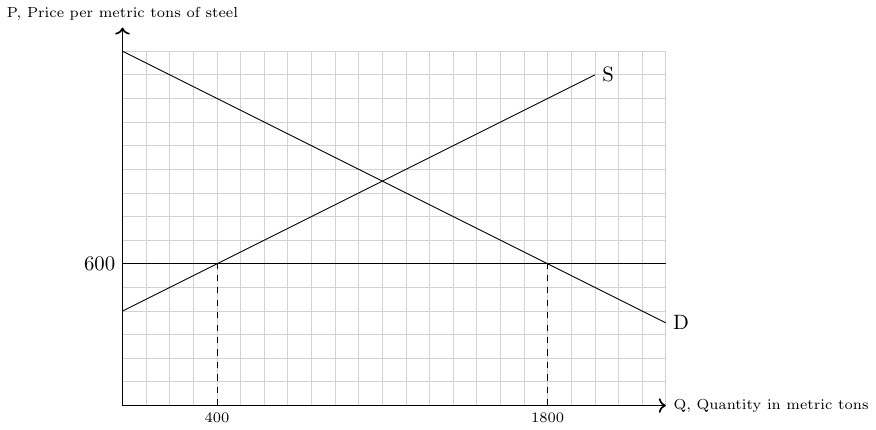
Referring to Figure 9.20, the government of a large country needs your help to decide whether the introduction of a tariff of $100 per metric ton of on steel is a good idea, or not. At the current world market price of \(p^W=\) 600$, the country imports 14 millions metric tons of steel. The government expects that a tariff of $100 per ton of steel would decrease the world market price of steel for $1.
- Calculate how much the overall welfare gain (or loss) of the country would be in case the government decides to introduce a tariff of $ 100 per ton of steel. Assume thereby that the supply curve is given by \[ P^s=400+\frac{1}{2}Q^s \] and the demand curve is given by \[ P^d=1500-\frac{1}{2}Q^d. \] These curves are also shown in the figure below.
- What would be the tariff so high that it makes an import of steel prohibitively expensive.
- What would be the world market price so low that it makes any domestic production unprofitable.
- What would be the world market price so high that the country exports steel.