How to Use R for Data Science

Lecture Notes

Author
Affiliation

Prof. Dr. Stephan Huber

Published

July 18, 2024

Preface

About R

The programming language R enables you to handle, visualize, and analyze data. It is compatible with various operating systems (Windows, Mac, Linux) and can do a lot of things better compared to other programs like Python, Stata, Eviews, SPSS, SAS, and Excel. R is open source, extensively utilized, and there are abundant resources available for learning it. These notes are just my five cents.

About the cover of the notes

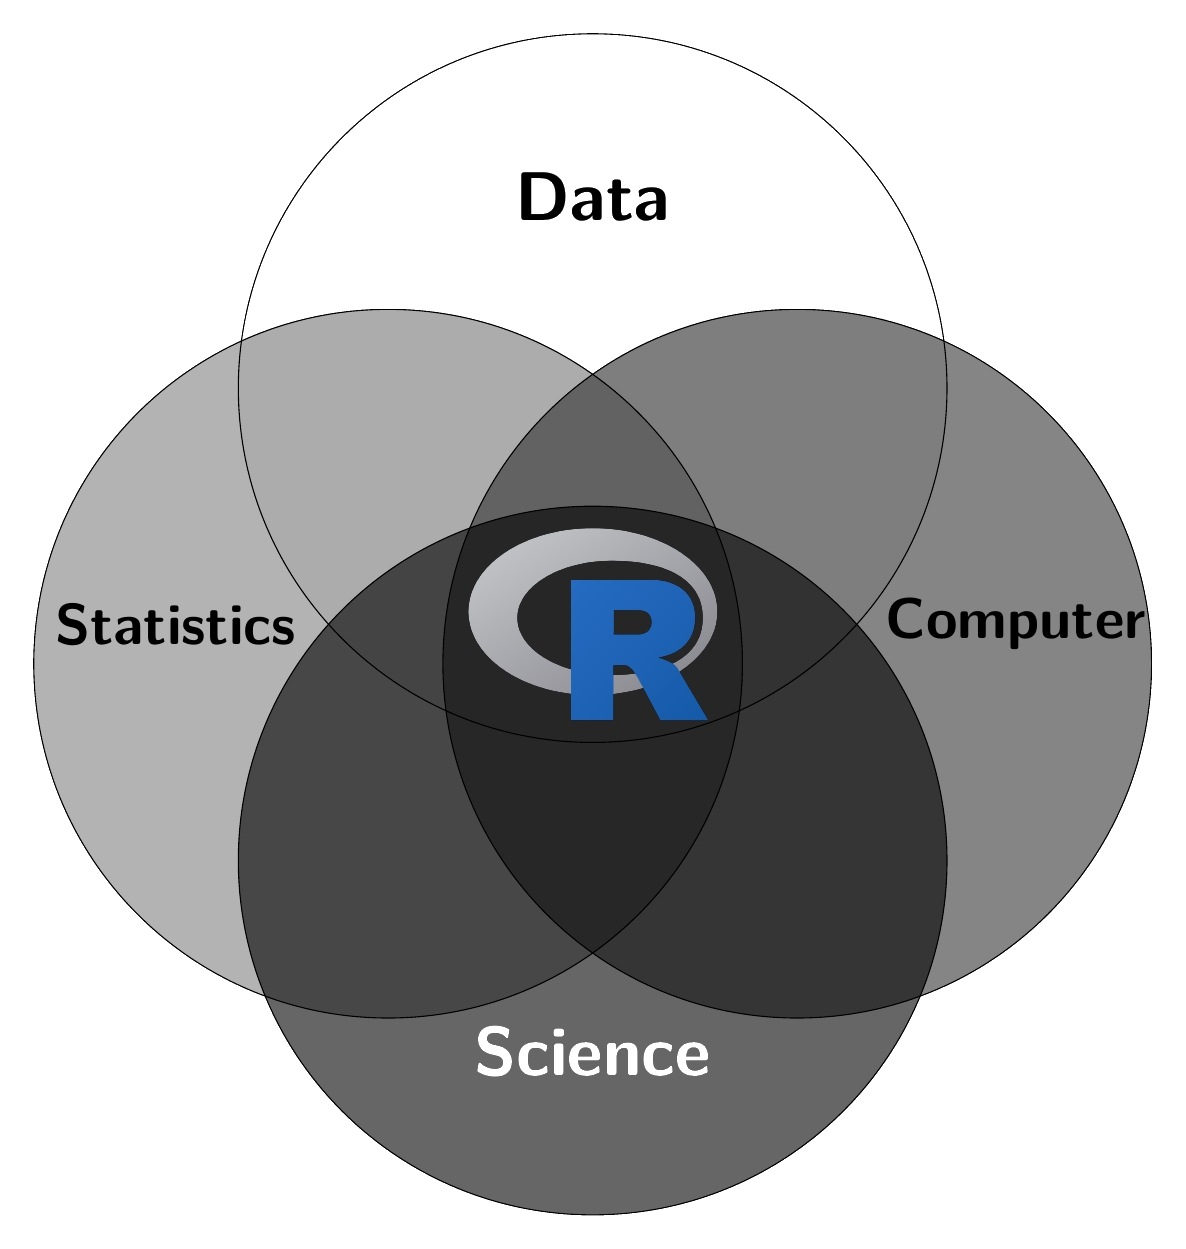
Data science is a buzzword that combines different fields of knowledge such as computer science, software engineering, informatics, database management, statistics, econometrics, business intelligence, and mathematics. However, there is no universally accepted definition of it and I think it is not important to define it precisely. Kelleher & Tierney (2018, p. 97) wrote “Data science is best understood as a partnership between a data scientist and a computer.” So data science is about embracing the power of computers for scientific, commercial or social purposes. Of course, empirical models and statistics play a role in gaining meaningful insights. The graphic on the cover page may illustrate that R combines four important fields, that are, data, science, computer, and statistics.

Kelleher, J. D., & Tierney, B. (2018). Data science. MIT Press.

About the notes

A PDF version of these notes is available here.

Please note that while the PDF contains the same content, it has not been optimized for PDF format. Therefore, some parts may not appear as intended.

  • These notes aims to support my lecture at the HS Fresenius but are incomplete and no substitute for taking actively part in class.
  • I hope you find this book helpful. Any feedback is both welcome and appreciated.
  • This is work in progress so please check for updates regularly.
  • These notes offer a curated collection of explanations, exercises, and tips to facilitate learning R without causing unnecessary frustration. However, these notes don’t aim to rival comprehensive textbooks such as Wickham & Grolemund (2023).
  • These notes are published under the Creative Commons Attribution-NonCommercial-NoDerivatives 4.0 International License. This means it can be reused, remixed, retained, revised and redistributed as long as appropriate credit is given to the authors. If you remix, or modify the original version of this open textbook, you must redistribute all versions of this open textbook under the same license. This script draws from the work of Navarro (2020), Muschelli & Jaffe (2022), Thulin (2021), and Ismay & Kim (2022) which is also published under the same license.
  • I host the notes in a GitHub repo.
Wickham, H., & Grolemund, G. (2023). R for data science (2e). https://r4ds.hadley.nz/
Navarro, D. (2020). Learning statistics with r (Version 0.6). https://learningstatisticswithr.com
Muschelli, J., & Jaffe, A. (2022). Introduction to R for public health researchers. GitHub. https://github.com/muschellij2/intro_to_r
Thulin, M. (2021). Modern statistics with R: From wrangling and exploring data to inference and predictive modelling. Eos Chasma Press. https://www.modernstatisticswithr.com/
Ismay, C., & Kim, A. Y. (2022). Statistical inference via data science: A ModernDive into R and the tidyverse. CRC Press. https://moderndive.com/
To reap the best benefits from studying,

I recommend to copy all the code that is shown in the book into a R script and try to run it on your PC. That is the best way to learn, understand, and create your own notes that may guide you later on. Whenever you see interesting code somewhere, try to run it on your PC. Moreover, I recommend the exercises of the book, they are challenging sometimes but to really understand code you need to run code yourself.

Structure of these notes

Chapter Explanations
…R Learn the basics everyone should know about R and RStudio, including how to install them.
…writing code Learn the basics of writing code.
writing R scripts Learn how to use R scripts and their benefits.
Interactive introduction using swirl A hands-on tutorial on how to use the swirl package. This section is optional.
Kickstart A quick start guide for beginners on how to dive into R, showcasing some of its capabilities.
Pitfalls Discover common mistakes beginners often make and how to avoid them to save time on troubleshooting.
Manage data Learn how to manipulate data in R.
Visualize data A quick guide on where to find resources to learn about creating graphical visualizations in R.
Collection of exercises A set of exercises to practice R programming skills.
Appendix A set of useful stuff that will help you to navigate through your file system, find the right operator and function, or to learn some useful shortcuts.

About the author

Prof. Dr. Stephan Huber
Hochschule Fresenius für Wirtschaft & Medien GmbH
Im MediaPark 4c
50670 Cologne

Office: 4e OG-3
Telefon: +49 221 973199-523
Mail: stephan.huber@hs-fresenius.de
Private homepage: www.hubchev.github.io
Github: https://github.com/hubchev

Figure 1: Prof. Dr. Stephan Huber

I am a Professor of International Economics and Data Science at HS Fresenius, holding a Diploma in Economics from the University of Regensburg and a Doctoral Degree (summa cum laude) from the University of Trier. I completed postgraduate studies at the Interdisciplinary Graduate Center of Excellence at the Institute for Labor Law and Industrial Relations in the European Union (IAAEU) in Trier. Prior to my current position, I worked as a research assistant to Prof. Dr. Dr. h.c. Joachim Möller at the University of Regensburg, a post-doc at the Leibniz Institute for East and Southeast European Studies (IOS) in Regensburg, and a freelancer at Charles University in Prague.

Throughout my career, I have also worked as a lecturer at various institutions, including the TU Munich, the University of Regensburg, Saarland University, and the Universities of Applied Sciences in Frankfurt and Augsburg. Additionally, I have had the opportunity to teach abroad for the University of Cordoba in Spain, the University of Perugia in Italy, and the Petra Christian University in Surabaya, Indonesia. My published work can be found in international journals such as the Canadian Journal of Economics and the Stata Journal. For more information on my work, please visit my private homepage at hubchev.github.io.

I was always fascinated by data and statistics. For example, in 1992 I could name all soccer players in Germany’s first division including how many goals they scored. Later, in 2003 I joined the introductory statistics course of Daniel Rösch. I learned among others that probabilities often play a role when analyzing data. I continued my data science journey with Harry Haupt’s Introductory Econometrics course, where I studied the infamous Jeffrey M. Wooldridge (2002) textbook. It got me hooked and so I took all the courses Rolf Tschernig offered at his chair of Econometrics, where I became a tutor at the University of Regensburg and a research assistant of Joachim Möller. Despite everything we did had to do with how to make sense out of data, we never actually used the term data science which is also absent in the more 850 pages long textbook by Wooldridge (2002). The book also remains silent about machine learning or artificial intelligence. These terms became popular only after I graduated. The Harvard Business Review article by Davenport & Patil (2012) who claimed that data scientist is “The Sexiest Job of the 21st Century” may have boosted the popularity.

Wooldridge, J. M. (2002). Introductory econometrics: A modern approach. In Delhi: Cengage Learnng (2nd ed.). South-Western.
Davenport, T. H., & Patil, D. (2012). Data scientist: The sexiest job of the 21st century. Harvard Business Review, 90(5), 70–76.

The term “data scientist” has become remarkably popular, and many people are eager to adopt this title. Although I am a professor of data science, my professional identity is more like that of an applied, empirically-oriented international economist. My hesitation to adopt the title “data scientist” also stems from the deep respect I have developed through my interactions with econometricians and statisticians. Considering their in-depth expertise, I feel like a passionate amateur.

Ultimately, I poke around in data to find something interesting. Much like my ten-year-old younger self who analyzed soccer statistics to gain a deeper understanding of the sport. The only thing that has changed since then is that I know more promising methods and can efficiently use tools for data processing and data analysis.