10 Allocation
Required readings: Emerson (2019, ch. 10 and 11),
Recommended readings: Anon (2020, ch. 6)
Learning outcomes:
Students will be able to:
- Explain what is meant by an efficient allocation of resources in an economy and describe the market conditions that must exist to achieve this goal.
- Define consumer and producer surplus.
10.1 How markets allocate resources
Markets use prices as signals to allocate resources to their highest valued uses. More specifically, it is the interaction of demand and supply in markets that generates prices that serve to allocate items to their highest valued alternatives. Consumers will pay higher prices for goods and services that they value more highly. Producers will devote more resources to the production of goods and services that have higher prices, all else being equal. Similarly, workers will provide more hours of labor to jobs that pay higher salaries.
This allocation principle applies to all free and well functioning markets such as product markets for items such as cars, houses, and haircuts, as well as to resource markets for items such as labor, land, and equipment. Factors that interfere with the workings of a competitive market result in an inefficient allocation of resources, leading to a reduction in society’s overall well-being.
10.2 Efficient allocation of resources
Remember Milton Friedman’s words:
There was no commissar sending out orders from some central office. It was the magic of the price system: the impersonal operation of prices that brought them together and got them to cooperate, to make this pencil, so you could have it for a trifling sum.
Literally thousands of people cooperated to make this pencil. […] It was the magic of the price system—the impersonal operation of prices that brought them together and got them to cooperate to make this pencil so that you could have it for a trifling sum.
Also, recall Adam Smith, who wrote in perhaps the most influential book in economics, An Inquiry into the Nature and Causes of the Wealth of Nations (Smith, 1776), that the pursuit of self-interest in a marketplace would promote the general interest. He stated that resources would be guided, as if by an invisible hand, to their best uses. That invisible hand was the marketplace.
Smith, A. (1776). An inquiry into the nature and causes of the wealth of nations. Adam; Charles Black.
- When the net benefits of all economic activities are maximized, economists say the allocation of resources is efficient.
- The concept of an efficient allocation of resources incorporates production, but it also includes efficiency in the consumption of goods and services.
The ‘magic’ (usually) only happens if the assumptions of the classical model and perfect markets, respectively, hold.
In the upcoming sections, we will discuss some examples where markets are not efficient and welfare is suboptimal. Before that, however, we need to introduce a way to measure welfare.
Exercise 10.1 Greed
Watch Gordon Gekko’s “Greed is good” speech from the movie Wall Street (see Figure 10.1).

Source: IMDb.com
Source: Youtube
Discuss the relationship between greed, the law of demand, and perfect markets.
10.3 Consumer and producer surplus
In our discussions, we’ve gained an understanding of market dynamics, exploring how the interplay of supply and demand shapes prices. Now, we explore whether the equilibrium achieved in the market is truly optimal for both consumers and suppliers. Consumer surplus and producer surplus are helpful concepts in economics for welfare analysis. They help us understand the benefits that consumers and producers gain from participating in a market exchange.
Source: Anon (2020, ch. 6.2)
Anon. (2020). Principles of economics (2nd ed.). saylor.rog. https://saylordotorg.github.io/text_principles-of-economics-v2.0/index.html
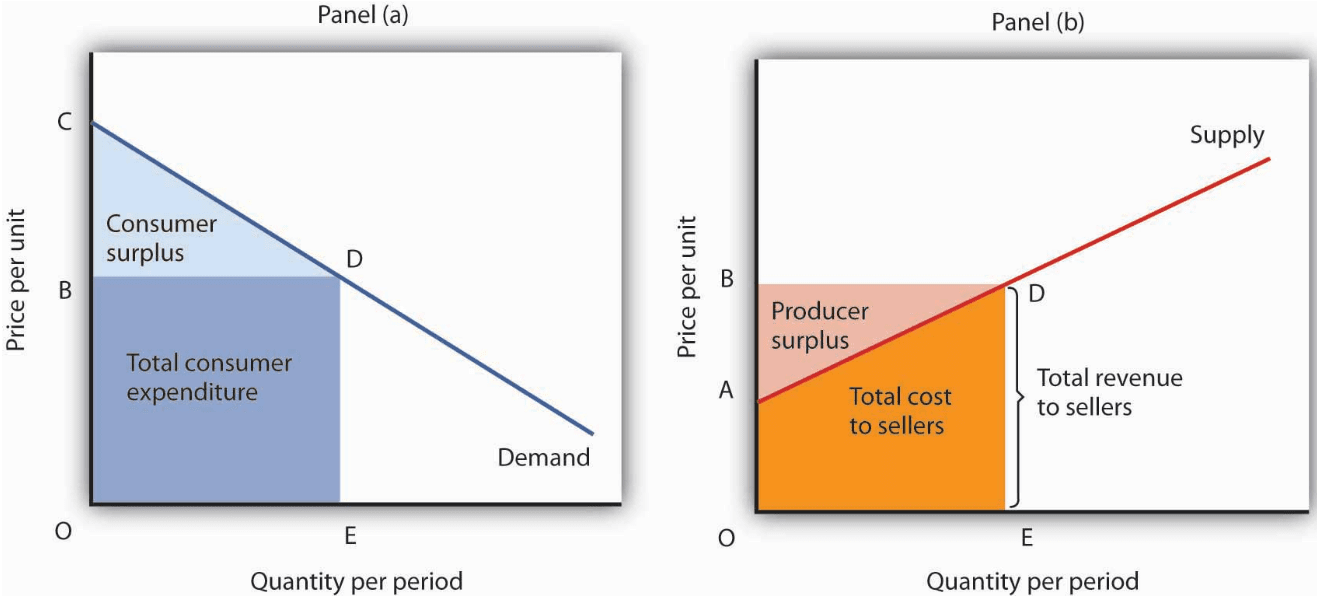
Consumer surplus refers to the additional value that consumers receive beyond what they actually pay for a product or service in the market. It is essentially the difference between what consumers are willing to pay for a good or service (their willingness to pay) and the actual price they pay.
On the other side, producer surplus pertains to the benefit that producers receive from market transactions. It’s the difference between the price at which producers are willing to supply a good or service and the actual price they receive. This surplus highlights the additional revenue that producers gain beyond what they need to cover their production costs.
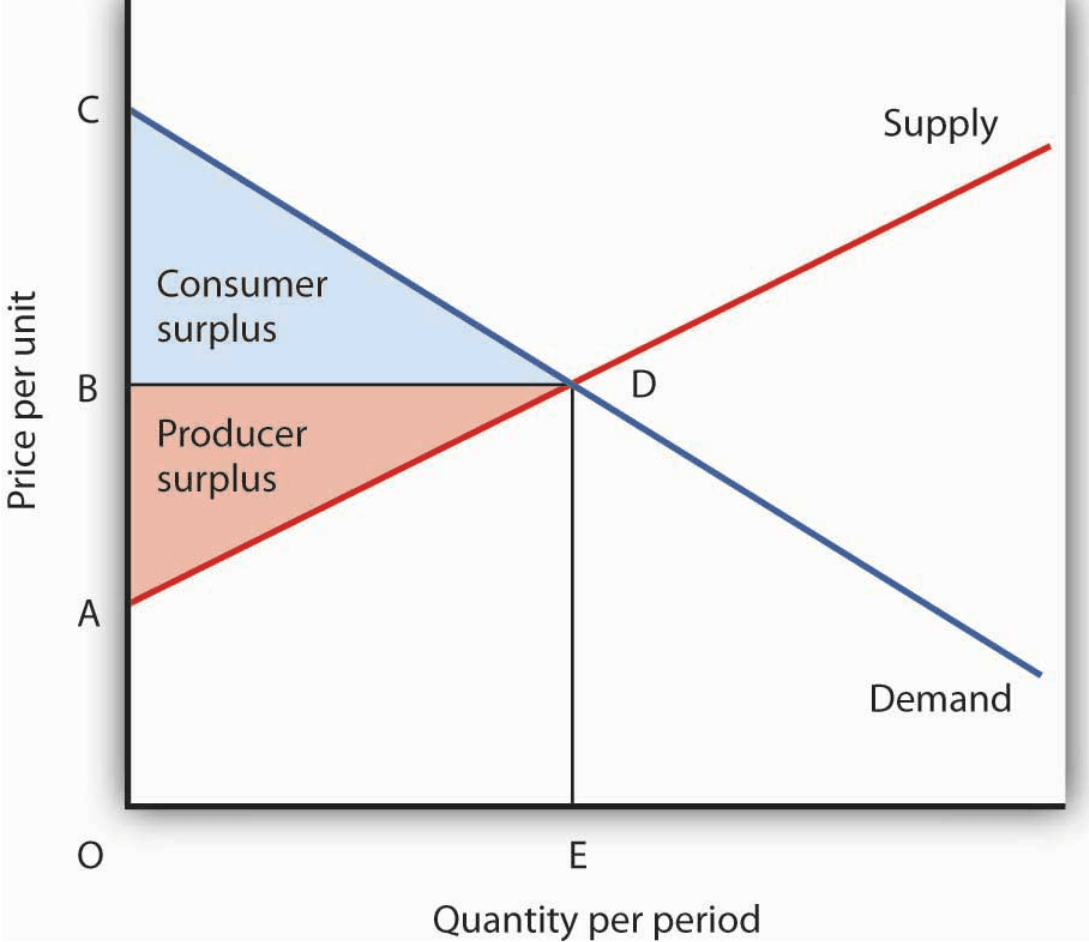
Both consumer surplus and producer surplus contribute to the overall economic welfare in a market. Maximizing both surpluses ensures that resources are allocated efficiently, benefiting both sides of the exchange and contributing to societal well-being. The equilibrium point where these surpluses are maximized is the point where the demand and supply curves intersect. Figure 10.3 visualizes the explained concepts.
Exercise 10.2 Welfare and taxes
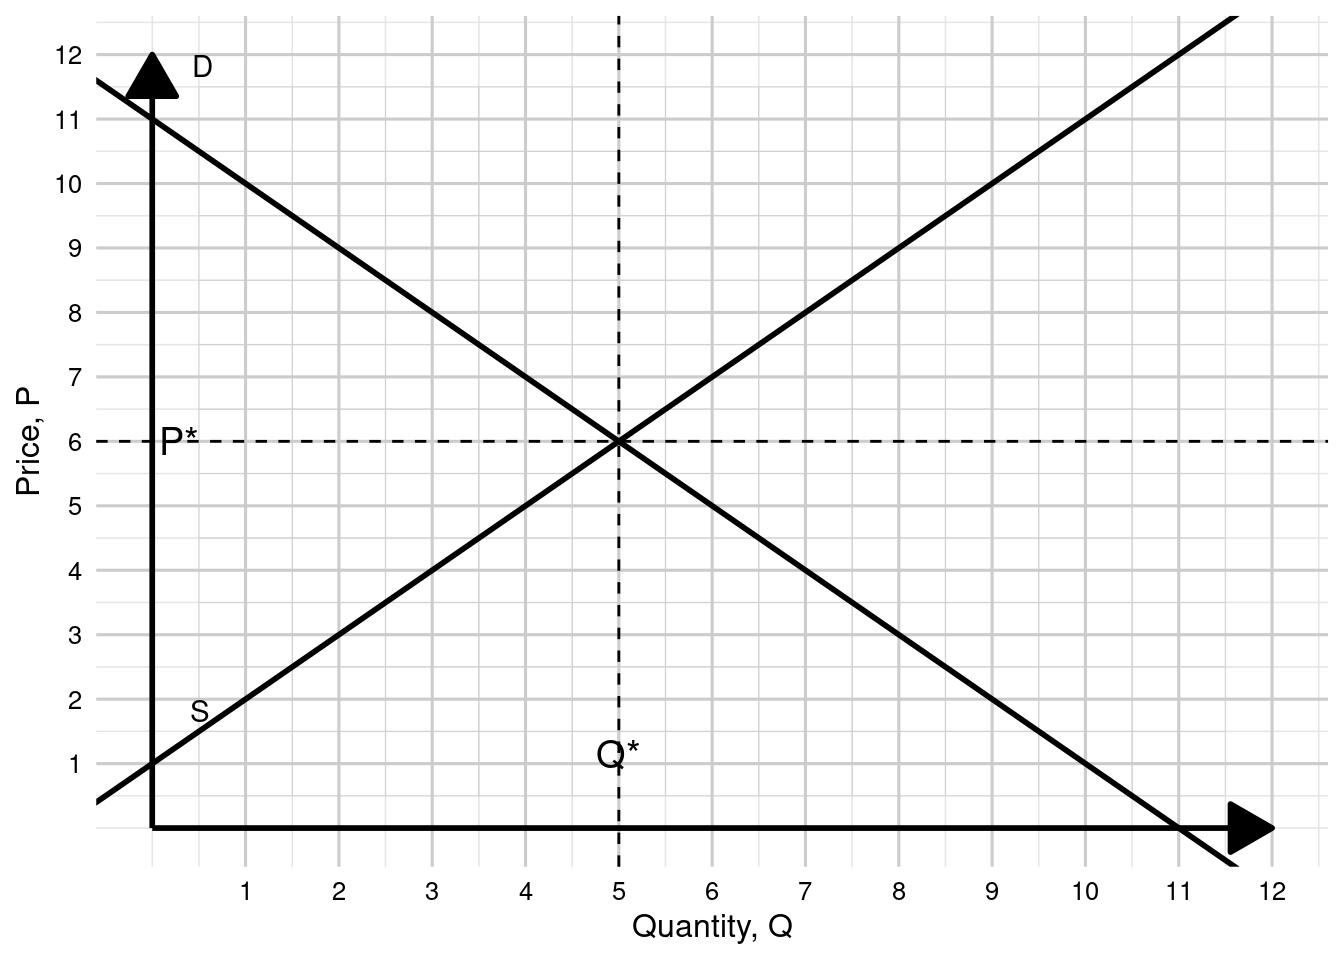
- The following diagram shows the supply and demand schedule for a given good in a closed economy, where \(P^* = 6\) denotes the equilibrium market price in € and \(Q^* = 5000\) denotes the equilibrium quantity traded in the market. Calculate producer surplus, consumer surplus, and total welfare, and sketch them in the diagram below.
- Using the diagram above, discuss the impact of a 16.6% value-added tax per unit sold (the price consumers now have to pay is 7 €) on the quantity traded. Calculate producer surplus, consumer surplus, and total welfare.
TipSolution
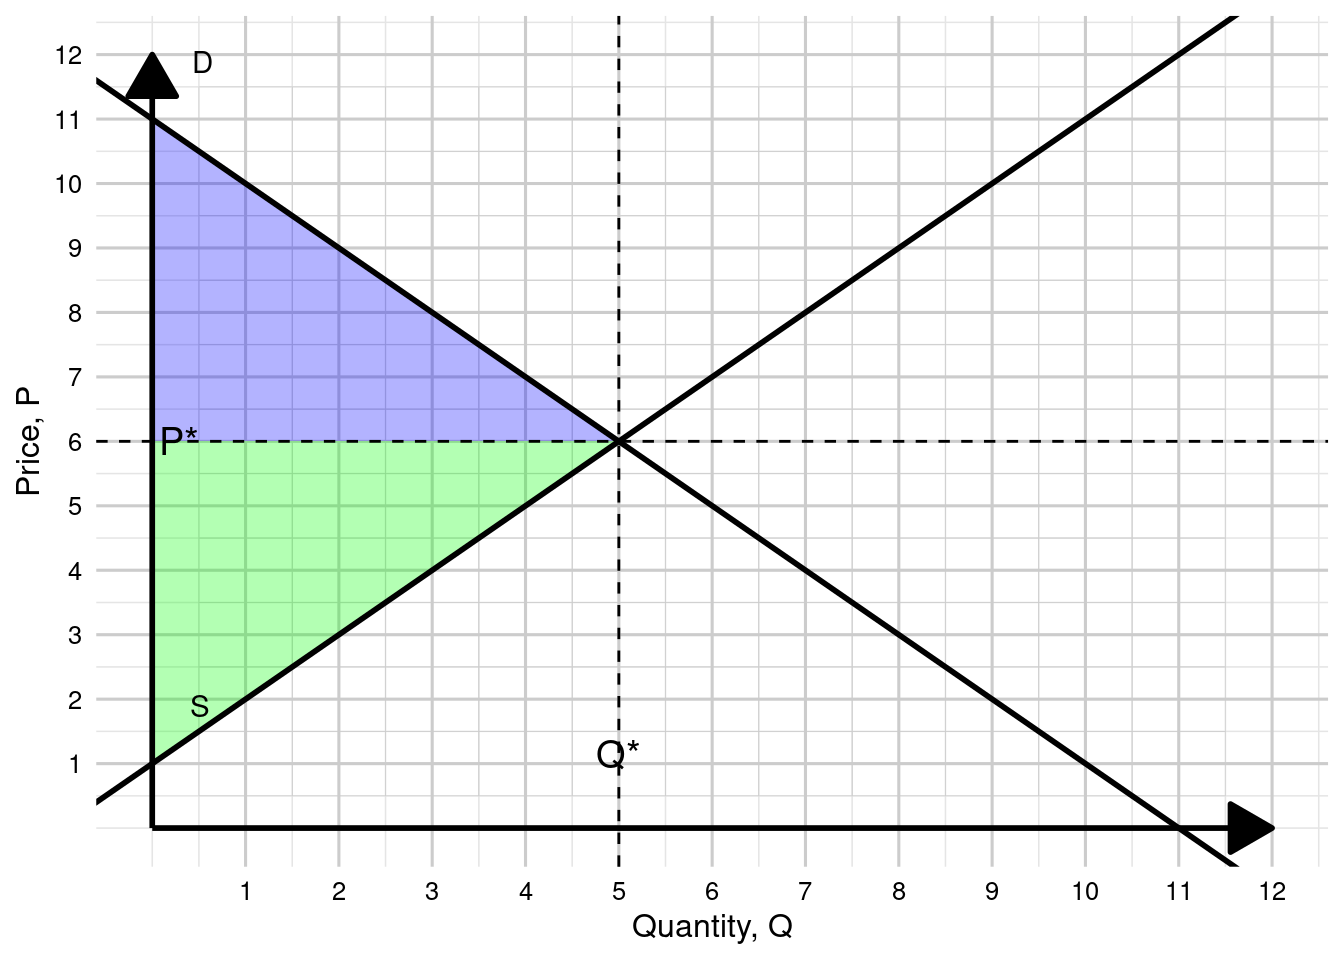
As shown in Figure 10.5, the blue triangle represents consumer surplus, while the green triangle represents producer surplus. Both surpluses summed together give total welfare.
- Consumer Surplus (CS) = 12,500
- Producer Surplus (PS) = 12,500
- Total Welfare (TW) = 25,000
After the introduction of a 16.6% value-added tax:
- Consumer Surplus (CS) = 8,000
- Producer Surplus (PS) = 8,000
- Tax Revenue = 8,000
- Total Welfare (TW) = 24,000
10.4 Price ceilings and floors
Study Emerson (2019, ch. 11.3).
10.5 Taxes and subsidies
Study Emerson (2019, ch. 11.4).
Emerson, P. M. (2019). Intermediate microeconomics (O. S. University, Ed.; Versions 1st edition). Open Educational Resources. https://open.oregonstate.education/intermediatemicroeconomics
10.6 Summary
Economists use the model of supply and demand to analyze competitive markets.
In a competitive market, there are many buyers and sellers, each of whom has little or no influence on the market price.
The demand curve shows how the quantity of a good depends on the price.
- According to the law of demand, as the price of a good falls, the quantity demanded rises. Therefore, the demand curve slopes downward.
- In addition to price, other determinants of how much consumers want to buy include income, the prices of complements and substitutes, tastes, expectations, and the number of buyers.
- If one of these factors changes, the demand curve shifts.
The supply curve shows how the quantity of a good supplied depends on the price.
- According to the law of supply, as the price of a good rises, the quantity supplied rises. Therefore, the supply curve slopes upward.
- In addition to price, other determinants of how much producers want to sell include input prices, technology, expectations, and the number of sellers.
- If one of these factors changes, the supply curve shifts.
To analyze how any event influences a market, we use the supply and demand diagram to examine how the event affects the equilibrium price and quantity.
In market economies, prices are the signals that guide economic decisions and thereby allocate resources.
The equilibrium price is the price at which the quantity demanded equals the quantity supplied. It is determined by the intersection of the demand and supply curves.
A surplus exists if the quantity of a good or service supplied exceeds the quantity demanded at the current price; it causes downward pressure on price. A shortage exists if the quantity of a good or service demanded exceeds the quantity supplied at the current price; it causes upward pressure on price.
An increase in demand, all other things unchanged, will cause the equilibrium price to rise; quantity supplied will increase. A decrease in demand will cause the equilibrium price to fall; quantity supplied will decrease.
An increase in supply, all other things unchanged, will cause the equilibrium price to fall; quantity demanded will increase. A decrease in supply will cause the equilibrium price to rise; quantity demanded will decrease.
To determine what happens to equilibrium price and equilibrium quantity when both the supply and demand curves shift, you must know the direction each of the curves shifts and the extent to which each curve shifts.