6 Inflation
Recommended readings: CORE Econ (2025b, ch. 4)
Learning objectives:
Students will be able to:
- Discuss the concept of an aggregate measure for inflation.
- Assess the consequences of inflation for an economy.
In this section, we will explore the concept of inflation. We will begin by defining inflation and explaining how it can be measured. Then, we’ll address the challenges associated with measuring inflation and discuss why it is a potential threat to economic prosperity.
6.1 Measuring inflation
Prices can change over time. They can rise, fall or remain stable. Inflation refers specifically to a situation in which the price level is rising, while deflation describes a fall in prices. The inflation rate quantifies this change by indicating the percentage difference in the prices from one period to the next. But what is meant when we speak about the “prices” or the “price level”?
To accurately calculate the price level and the real GDP of a country that includes multiple goods, respectively, it is essential to determine the Consumer Price Index (CPI). The CPI measures the average prices paid by consumers for a fixed basket of consumer goods and services, providing insight into the overall price level in the economy.
Typically, the CPI is normalized to equal 100 in a reference base period. For example, if the reference base period is set between 1982 and 1984, with an average CPI of 100, then an observed CPI of 269.2 in May 2021 indicates a substantial price increase of 169.2 percent since that period.
6.1.1 The Consumer Price Index (CPI) in 5 steps
- Fix basket: Identify the prices that are most relevant to the typical consumer. National statistics agencies establish a market basket of goods and services commonly purchased by consumers and conduct regular surveys to determine the weights for these prices. For a visual representation of the various goods commonly purchased by typical consumers in Germany, you can refer to the informative Price Kaleidoscope as shown in Figure 6.1. For a discussion on the challenges to define a basket, see Section 6.1.2.
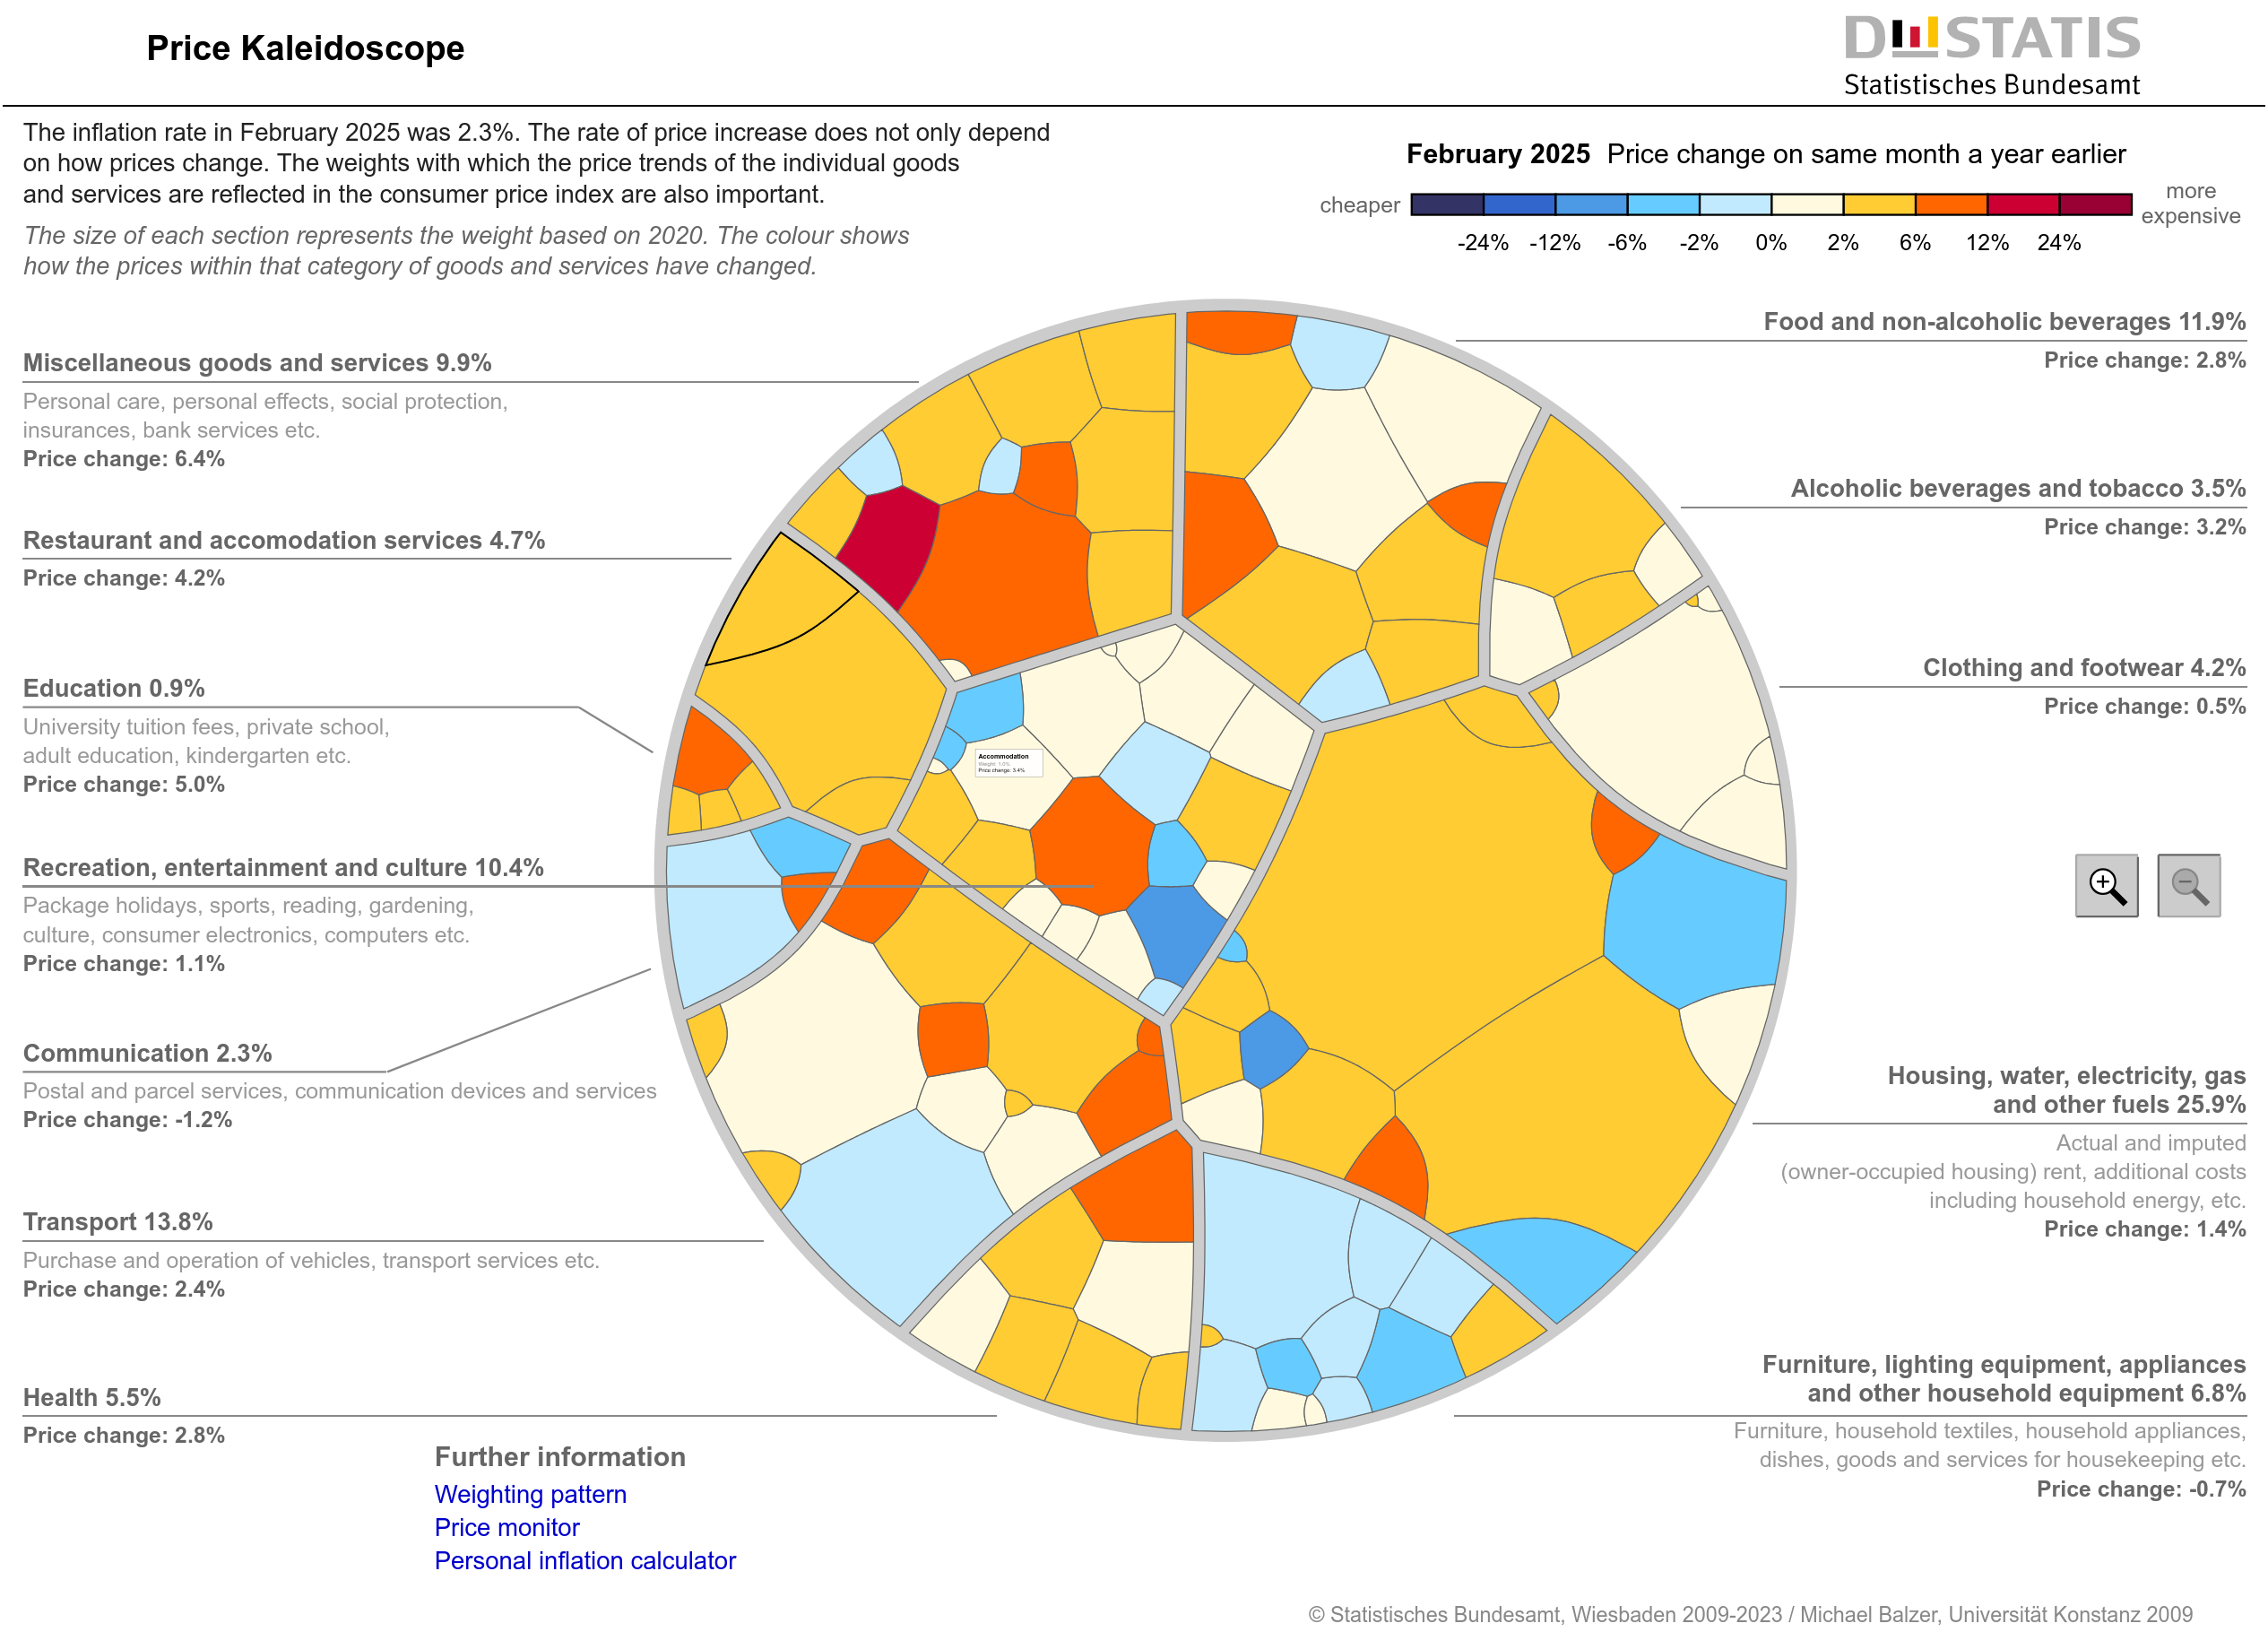
Source: Destatis (2025)
Find prices: Gather data on the prices of each good and service in the basket for each designated time period.
Compute basket’s cost: Use the price data to calculate the total cost of the basket of goods and services at various times.
Choose a base year and compute:
- Designate one year as the base year, serving as the benchmark for comparison.
- Compute the index by dividing the basket’s price in one year by the basket’s price in the base year, then multiplying by 100.
\[CPI=\frac{\textnormal{cost of basket in current year}}{\textnormal{cost of basket in base year}}\cdot 100\]
Compute the inflation rate: The inflation rate is the percentage change in the price index from the previous period. It is determined by the percentage change of the CPI from one year to the next. The formula is given by \[ h_t = \left(\frac{CPI_t - CPI_{t-1}}{CPI_{t-1}} \cdot 100\right), \] where \(h_t\) denotes the inflation rate at time \(t\) (this year), while \(CPI_t\) and \(CPI_{t-1}\) represent the CPI for time \(t\) and \(t-1\) (previous year), respectively.
For example, in May 2021, the CPI was 261.0, and in May 2020, it was 257.9. Using the formula, we find that the inflation rate between 2021 and 2020 was 1.2%.
6.1.2 Challenges of the CPI
While the CPI accurately reflects the prices of selected goods that comprise the typical basket, it is not a flawless measure of the cost of living. Several key issues can lead the CPI to overstate the true cost of living when the basket is held fixed over time including the following:
Substitution bias: Substitution bias occurs when the basket used to calculate the CPI does not adjust to reflect consumer responses to changes in relative prices. Consumers tend to substitute goods that have become relatively less expensive, which can lead the index to overstate the increase in the cost of living by not accounting for these substitution patterns.
Introduction of new goods: The introduction of new goods further complicates the CPI measurement, as the basket does not incorporate the changes in purchasing power that result from new products entering the market. With the addition of new goods, consumers experience a greater variety of options, which makes each euro more valuable. Consequently, consumers require less money to maintain a given standard of living as new products are introduced.
Unmeasured quality changes: Unmeasured quality changes also pose a challenge for accurately capturing the cost of living. If the quality of a good improves from one year to the next, the real value of a euro increases, even if the price of the good remains the same. Conversely, if the quality of a good declines, the value of a euro falls, regardless of whether its price remains constant. Although the Office for National Statistics (ONS) attempts to adjust prices for constant quality, accurately measuring these quality changes can be quite difficult.
6.2 High inflation and deflation
Unexpected fluctuations in inflation or deflation pose considerable challenges for society as they lead to a redistribution of income and wealth. For example, unexpected inflation usually benefits employees and borrowers, as their income can increase, reducing the real burden of their debt. Conversely, unexpected deflation usually favours employers and lenders as the value of money increases, making it more difficult for borrowers to meet their obligations.
These unexpected changes can force individuals and businesses to shift their focus from productive activities to predicting and protecting against economic volatility. In particular, unexpected deflation can cause indebted businesses and households to cut back on spending, which can ultimately lead to recession and higher unemployment rates.
In extreme cases, hyperinflation occurs, that is usually the how inflation rates of more than 50 per cent per month are called. This can seriously destabilise an economy. Thus, central banks and politicians seek to maintain low and stable inflation due to its various negative implications for the economy. Here is an summary of the most important implications:
Menu costs: High inflation forces businesses to frequently change their prices, resulting in lost time and increased costs.
Purchasing power loss: Inflation impacts individuals unevenly, with low-wage earners and those on fixed nominal incomes experiencing a loss of purchasing power.
Redistribution of wealth and income: As discussed in the section on real and nominal interest rates, rising inflation leads to decreasing real interest rates. Consequently, borrowers benefit from lower real interest payments, while lenders receive reduced real returns. This wealth redistribution occurs because debt is usually expressed in nominal terms, and inflation diminishes the actual value of fixed monetary sums.
Distorted price signals: Inflation disrupts the clarity of prices as indicators for resource allocation. Typically, prices provide critical information regarding supply and demand, aiding informed decision-making. Inflation blurs these signals, complicating the ability to differentiate between actual changes in value and overall price increases, thereby undermining the price mechanism that guides markets.
Uncertainties: High and volatile inflation creates uncertainty surrounding future prices. This uncertainty can prevent businesses and consumers from accurately assessing the real value of money, hampering long-term planning, saving, and investment, which can ultimately lead to economic instability.
Exercise 6.2 Global inflation
Investigate the inflation rates of selected countries online to grasp international differences and global trends. Tip: OECD Inflation Data
Discuss Figure 6.3.
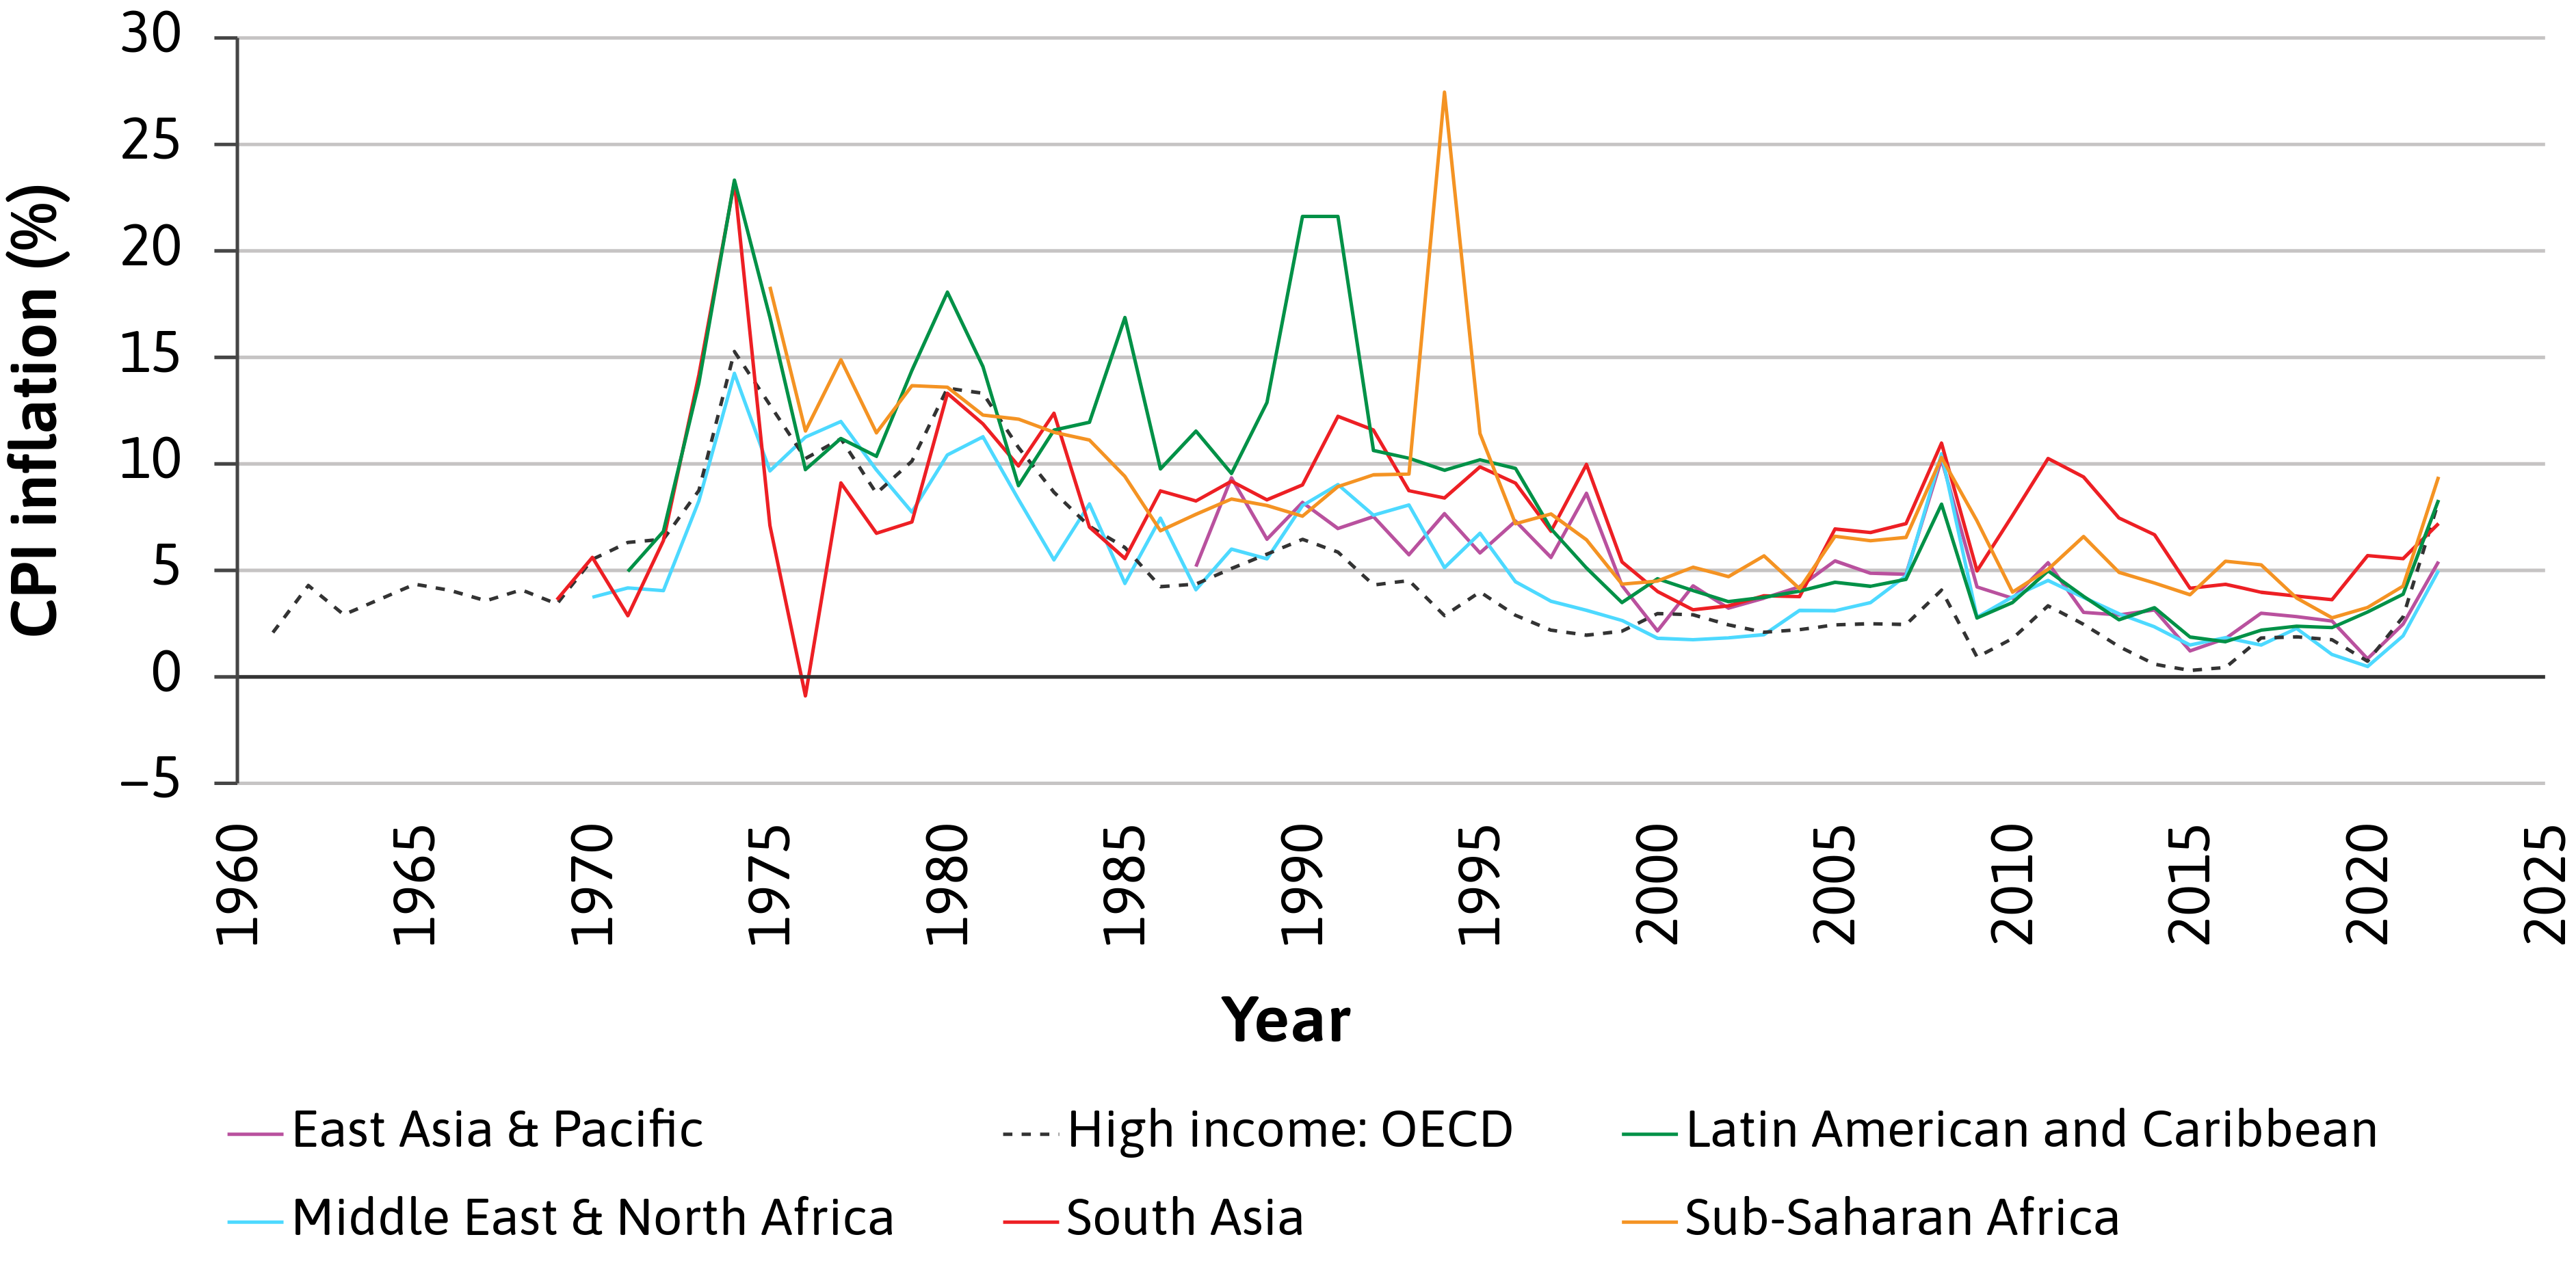
Source: CORE Econ (2025b, ch. 4.1)
- Discuss the two time series shown in Figure 6.3.
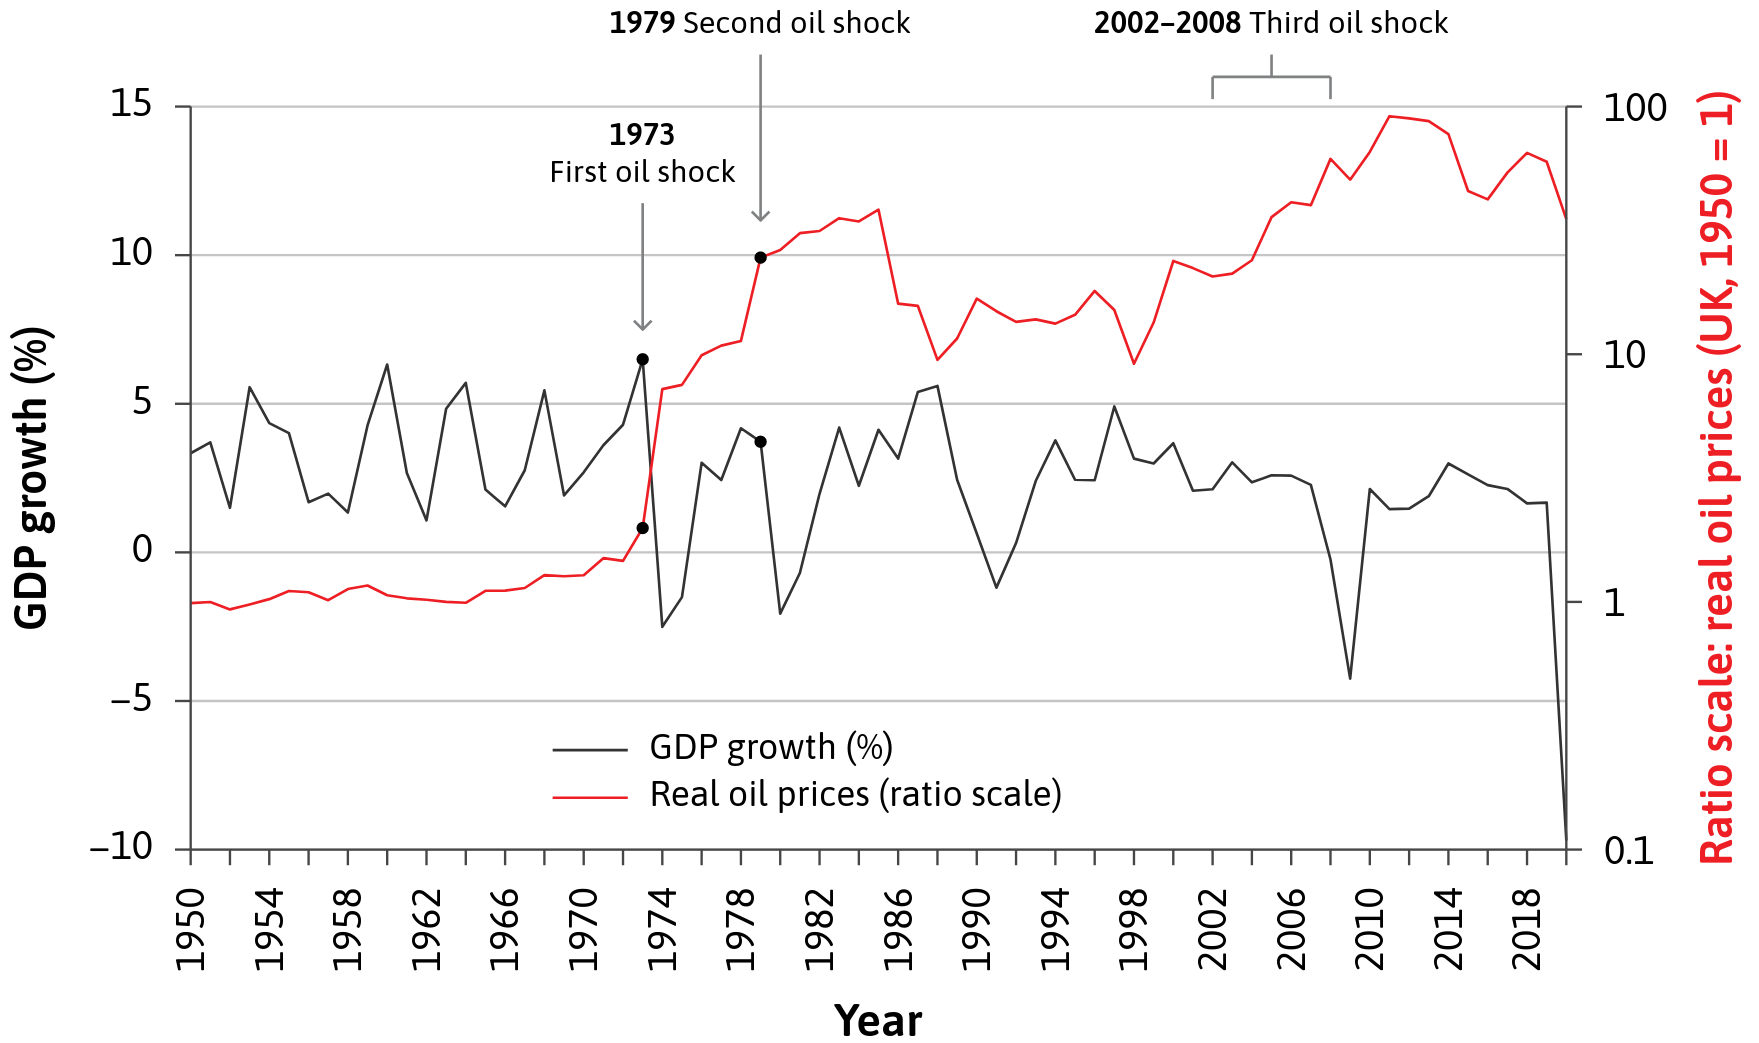
Source: CORE Econ (2025a, ch. 15.7)