29 Currencies
Learning objectives:
Students will be able to:
- Interpret exchange rates and explain how their fluctuations affect the relative prices of goods in different countries.
- Predict how changes in exchange rates can impact business decisions and national economies.
- Understand the relationship between interest rates and inflation in open economies.
- Explain the concepts of interest rate parity and purchasing power parity.
- Analyze and evaluate trade balances.
29.1 Introduction
An exchange rate indicates the value of one currency in relation to another. Exchange rate fluctuations have a significant impact on the revenues, costs, and profits of businesses; they affect how much you can afford to spend and can even influence job security.
Please work on the questions posed in Exercise 29.1 and Exercise 29.2. They are designed to motivate an introduction the topic.
Exercise 29.1 Exchange rates over time
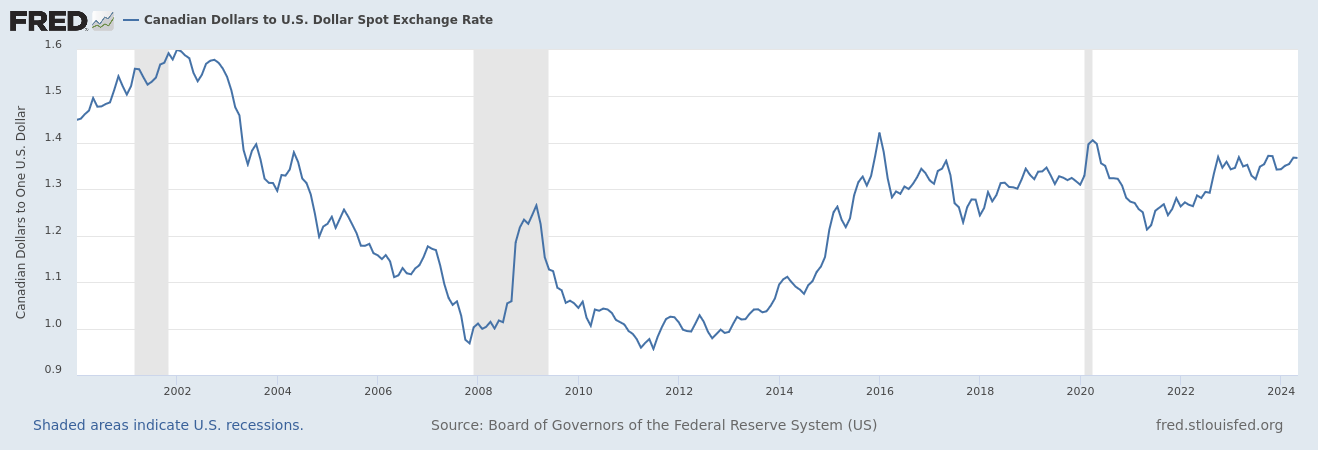
- As can be seen in Figure 29.1, 1 United States Dollar (USD) equals about 1.38 Canadian Dollar (CAD) today. Since January 2002, has the USD depreciated (lost value) or appreciated (gained value) against the CAD? Explain your decision.
- Assume that in January 2002, you exchanged a total of 2000 USD to Canadian Dollars (CAD) at a rate of 1.6 CAD per USD. Calculate how much that amount is worth today in USD.
Suppose you have 1000 USD today, that is January 2024, and you plan to invest it in a Canadian fund that assures you a 2% annual interest rate.
- Calculate how much USD you’ll have after one year if the exchange rate remains on its current level of 1.38 CAD per USD.
- Calculate how much USD you’ll have after one year if the exchange rate slightly chances to 1.42 CAD per USD.
Exercise 29.2 Our relations are not good
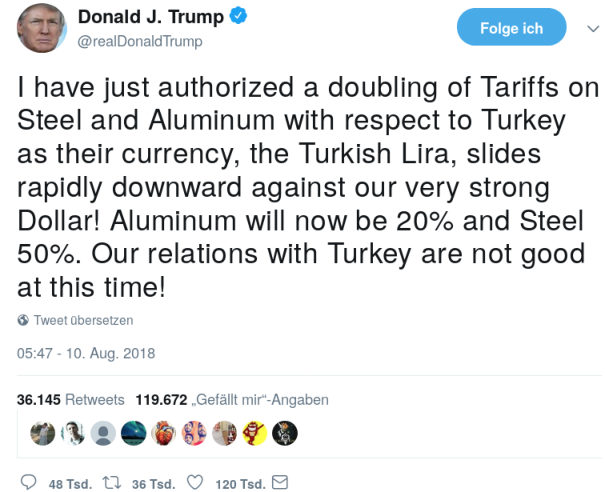
Source: Twitter
Why is Trump implicitly expressing concerns about the weak Lira and the strong Dollar? Would he prefer a “strong” Turkish Lira and a “weak” Dollar? What factors actually contribute to his satisfaction? Can you understand the logic behind President Trump’s decision to double metal tariffs in response to the decline of the Turkish Lira (see Figure 29.2)? Discuss.
29.2 Exchange rates
The most important economic indicators frequently discussed in the media and politics are Gross Domestic Product (GDP)1, the policy rate2, and the inflation rate3. These measures are designed to explain the functioning of economic markets and guide policymakers. However, the exchange rate is used less frequently in political and public debates, which I believe is a significant oversight for several reasons.
Firstly, similar to the aforementioned measures, exchange rate movements have a substantial impact on both markets and individuals. Moreover, the exchange rate serves as an accurate measure that reflects real market movements more quickly than most other indicators. Overall, a solid understanding of exchange rates is crucial for making informed decisions, managing financial risks, optimizing operations, and strategically positioning companies in the global marketplace.
Before I explain this in greater detail, let me share my explanations for why the exchange rate is relatively unnoticed in public debates:
- Complexity of interpretation: It is comparatively difficult to interpret. GDP should be rising, while the inflation and policy rates should ideally be low. In contrast, the exchange rate is not so straightforward because there isn’t a universally optimal exchange rate that everyone hopes for. The ideal rate depends on many factors, such as whether you want to buy goods from abroad or sell them to the rest of the world. Different stakeholders and investors will have varying preferences about the exchange rate. Many people, especially politicians, avoid the complexities of “it depends” arguments because it is challenging to make convincing cases based on intricate relationships.
- Volatility: The exchange rate is comparatively volatile, and its changes are difficult to predict.
- Multiple exchange rates: There isn’t just one exchange rate; there are many, as any currency can be exchanged for any other currency. This means that a country’s exchange rate may rise against currency A but fall against currency B.
- Limited political influence: The power of politics to directly and measurably influence a country’s exchange rate is limited.
- Understanding requirements: The impact of exchange rate movements on our lives requires a solid understanding of economic markets, which many people lack.
While I cannot change the factors that contribute to the limited discussion of exchange rates, I can work to help you make sense of this topic. Before discussing the importance of the exchange rate in Section 29.4, let’s first define the rate:
The price of one currency in terms of another is called an exchange rate. Exchange rates allow us to compare the prices of goods and services across countries, determining a country’s relative prices for exports and imports.
To define the rate more formally, suppose the Euro (€) is the home currency and Turkish Lira (₺) the foreign currency, then the exchange rate in direct quotation (Preisnotierung) is \[E^{\frac{\text{€}}{\text{₺}}}=\frac{X \text{€}}{Y \text{₺}}\] and the exchange rate in indirect quotation (Mengennotierung) is \[E^{\frac{\text{₺}}{\text{€}}}=\frac{Y \text{₺}}{X \text{€}}.\]
Both rates contain the same information, but have different interpretations:
- \(E^{\frac{\text{€}}{\text{₺}}}\) tells that we have to give X to receive Y , whereas
- \(E^{\frac{\text{₺}}{\text{€}}}\) tells that we have to give Y to receive X .
Alternative interpretations:
- \(E^{\frac{\text{€}}{\text{₺}}}\) tells that we have to give \(\frac{X}{Y} \text{€}\) to receive 1 , whereas
- \(E^{\frac{\text{₺}}{\text{€}}}\) tells that we have to give \(\frac{Y}{X} \text{₺}\) to receive 1 .
A currency can appreciate or depreciate relative to other currencies.
- If the € appreciates, \(E^{\frac{\text{€}}{\text{₺}}}\) decreases and \(E^{\frac{\text{₺}}{\text{€}}}\) increases.
- If the € depreciates, \(E^{\frac{\text{€}}{\text{₺}}}\) increases and \(E^{\frac{\text{₺}}{\text{€}}}\) decreases.
- Euro to Dollar means \(\frac{\text{€}}{\$}\) (This is especially confusing and it can also be understood the other way round but the first currency mentioned is usually interpreted as the numerator)
- Euro per Dollar means \(\frac{\text{€}}{\$}\)
- Euro in Dollar means \(\frac{\$}{\text{€}}\)
- 1 Euro costs X Dollars means X \(\frac{\$}{\text{€}}\)
Exercise 29.3 Interpret the exchange rate representations shown in Figure 29.3. Consider the Euro as the home currency and write the most recent currency rates of the four figures in direct quotation.
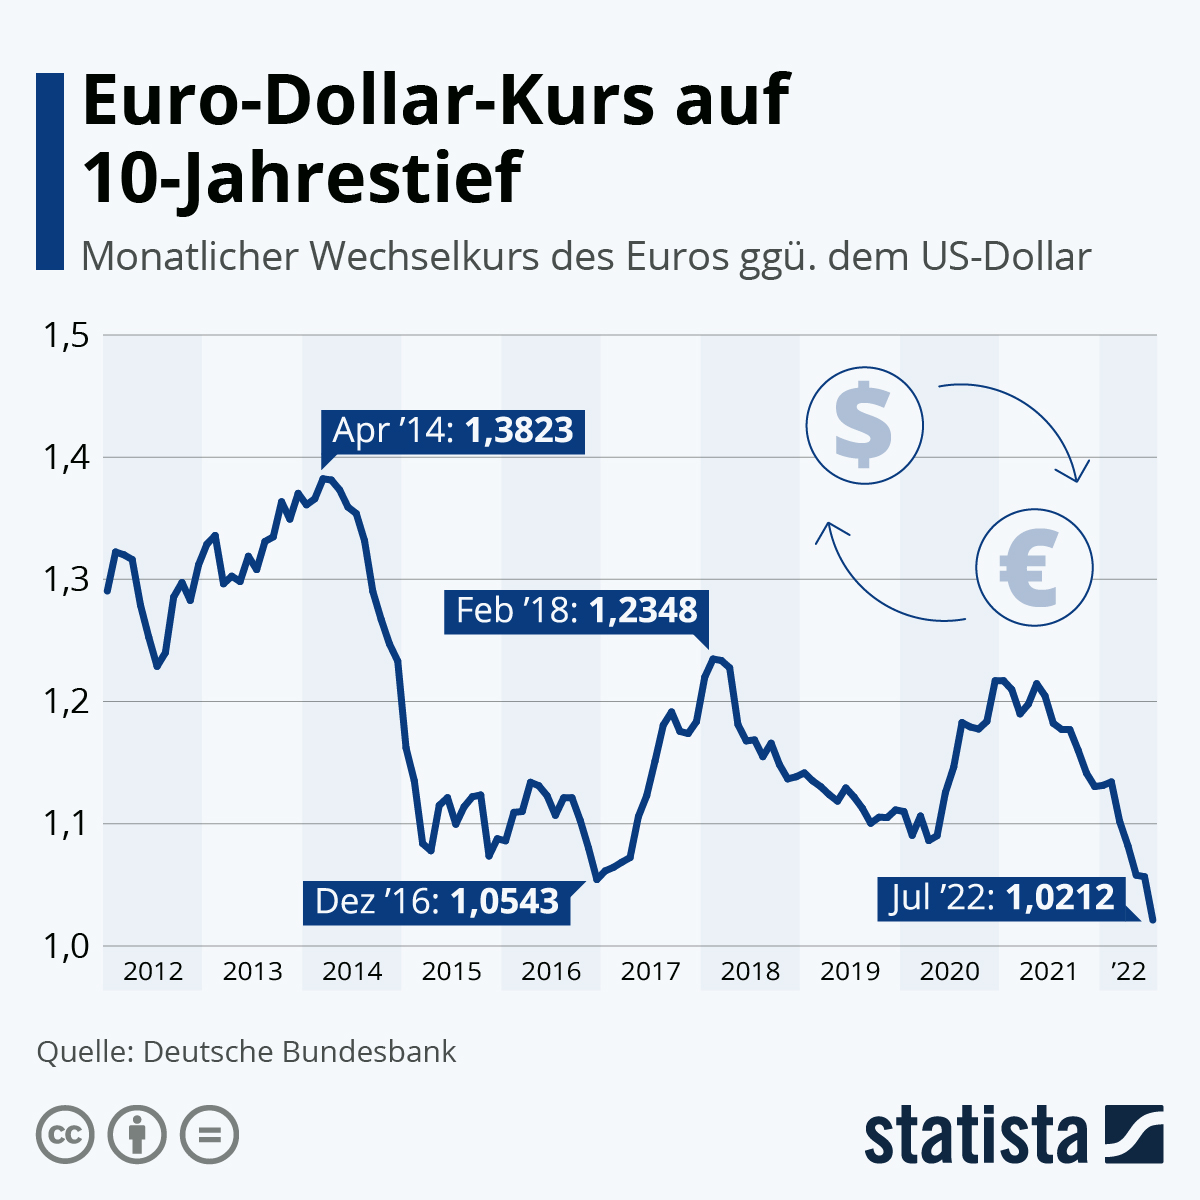
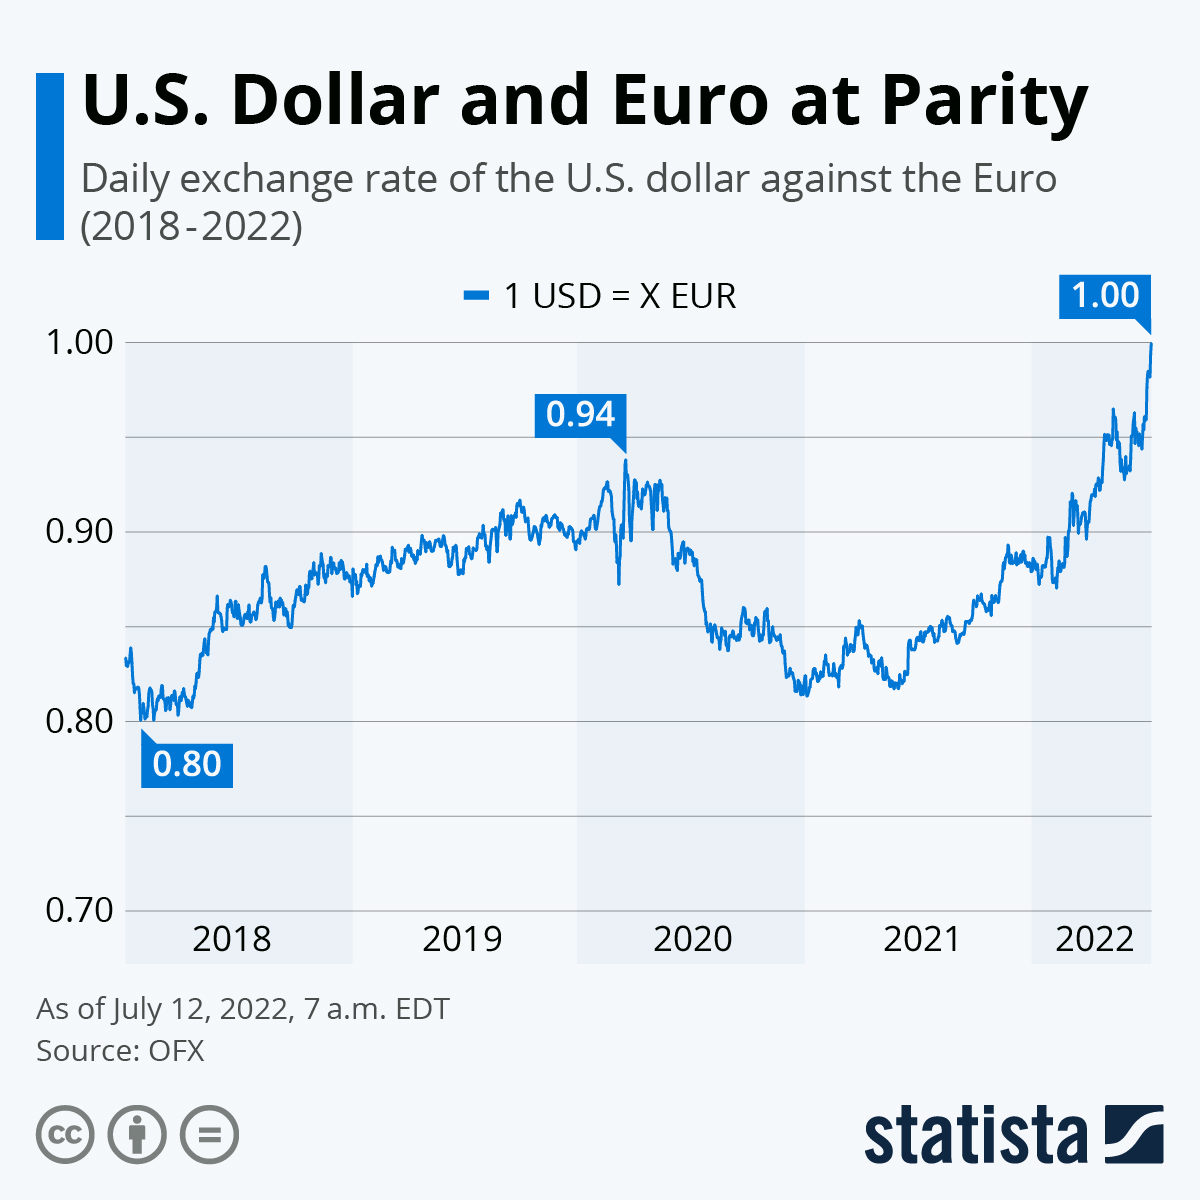
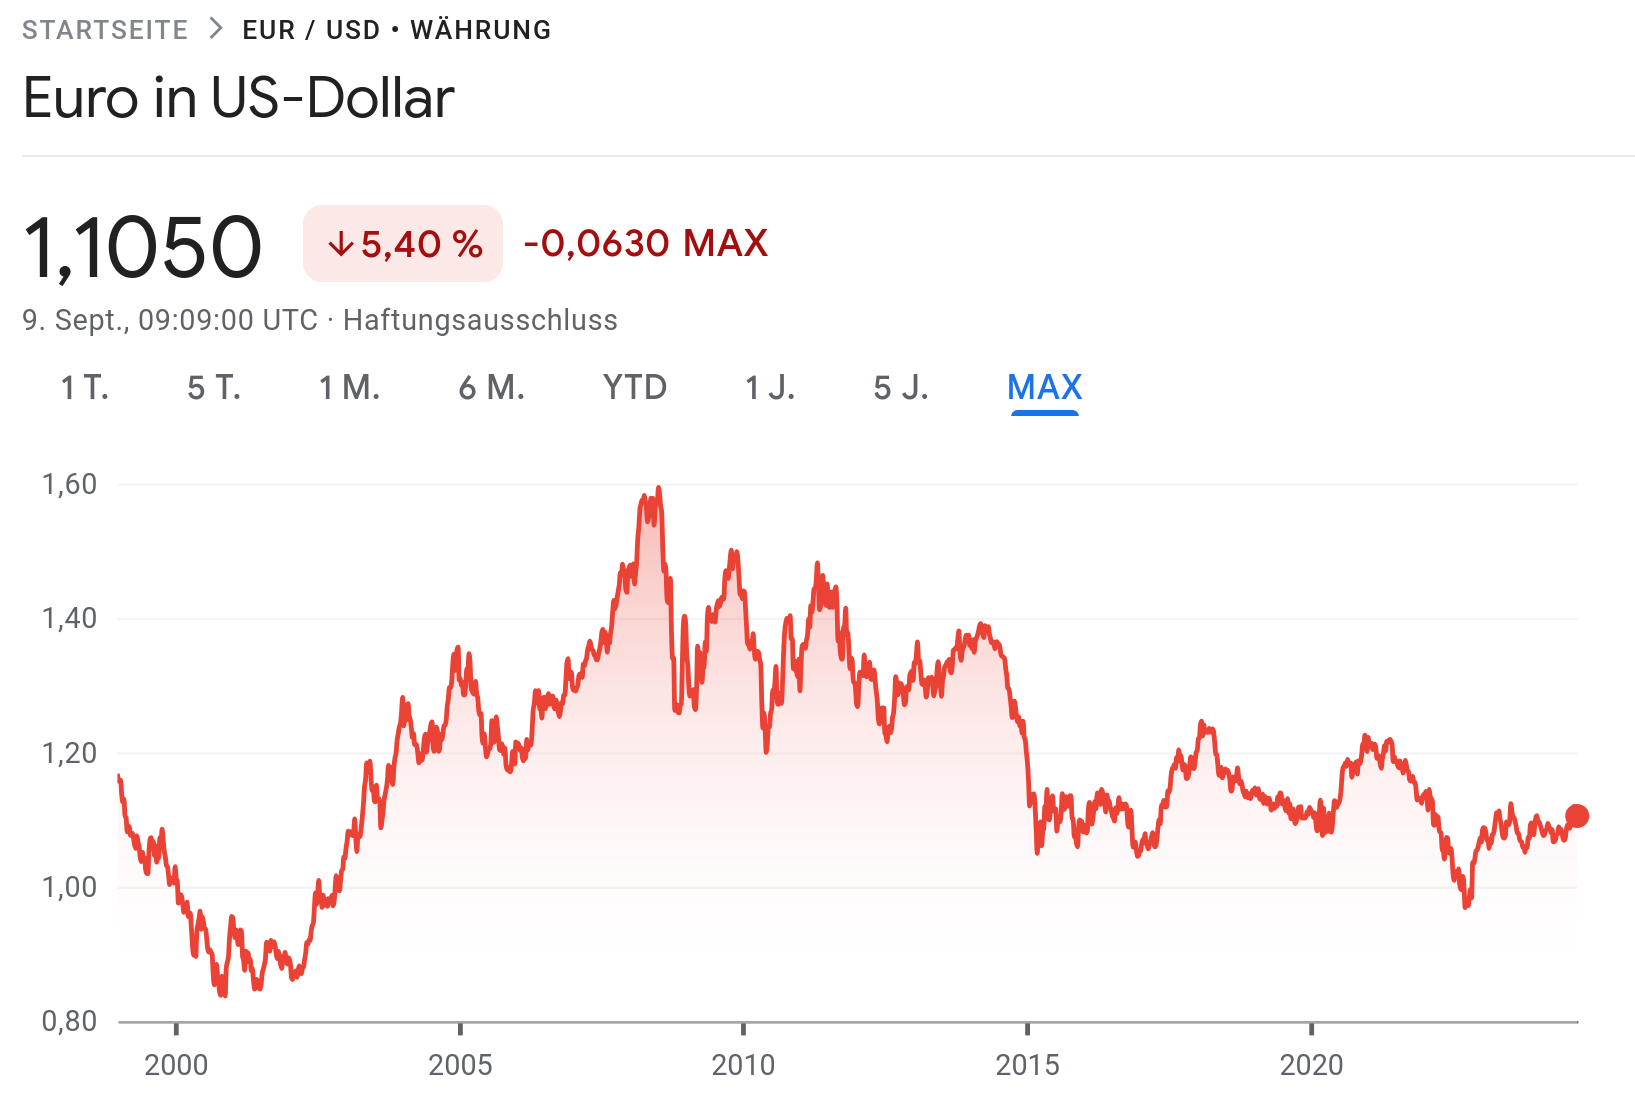
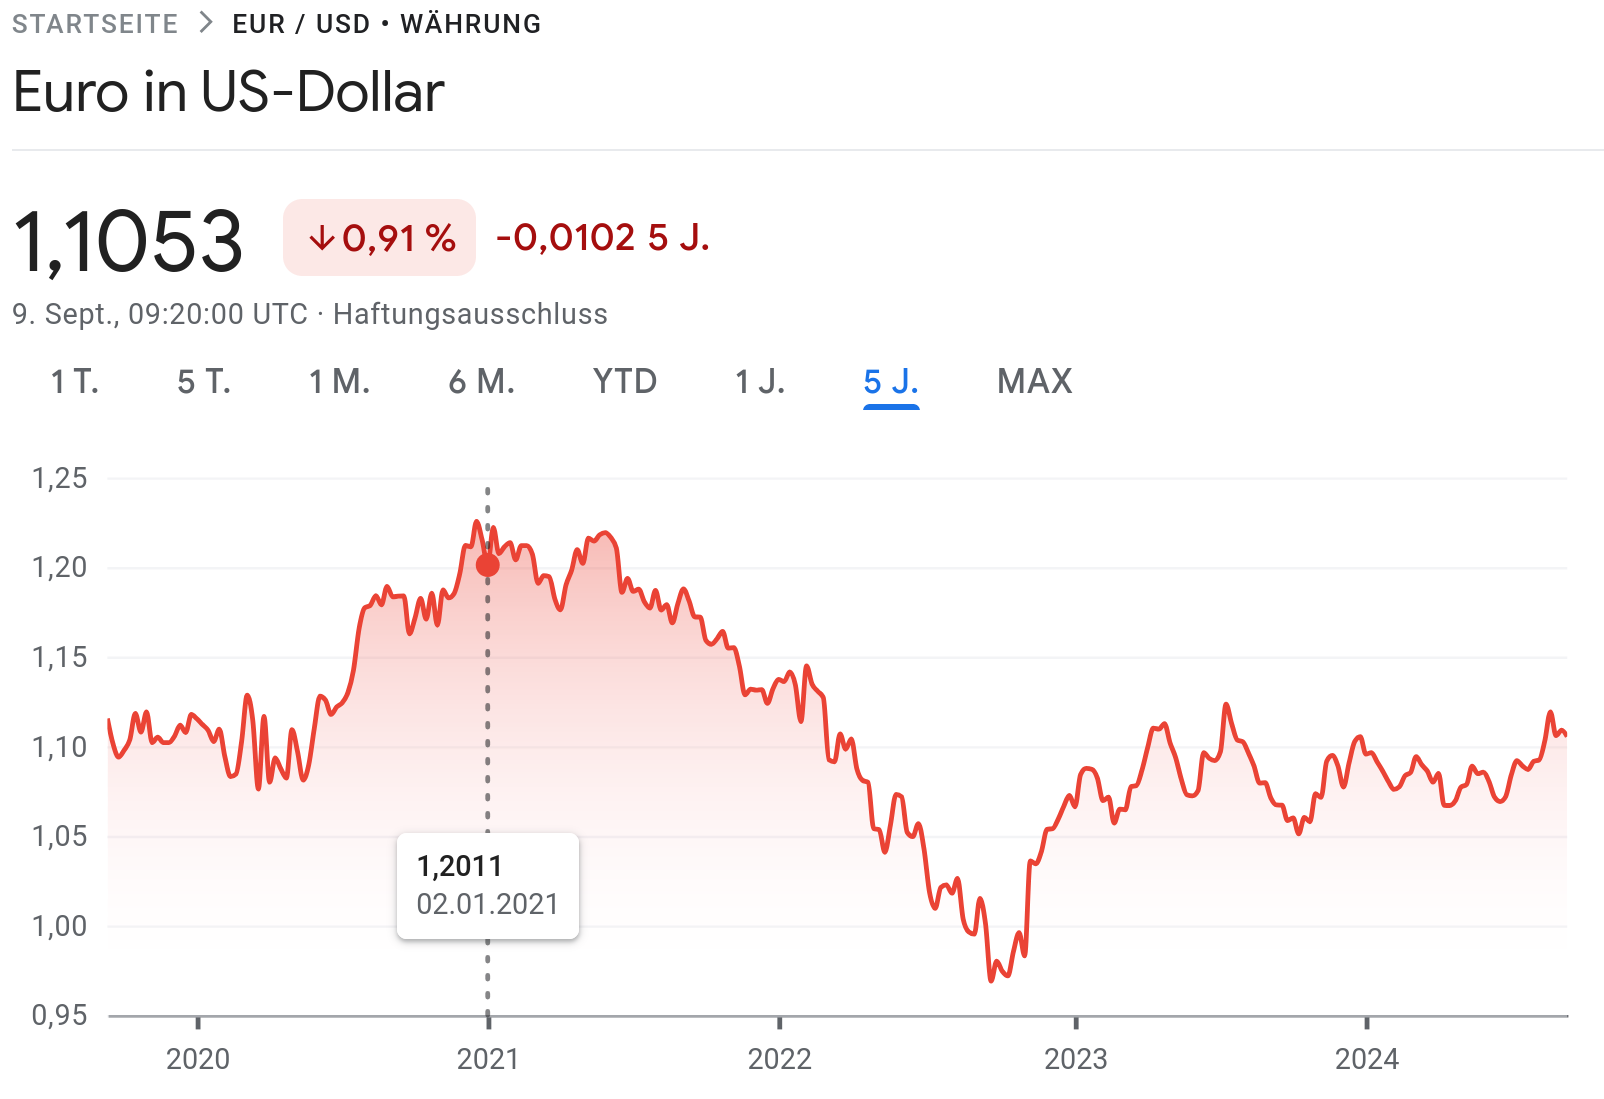
Source: Subfigures (c) and (d) are taken from Google.
29.3 Relative prices and exchange rates
After understanding the concept of exchange rates, let us consider how trade in goods between two countries operates when each country uses a different currency as its legal tender.
Let us consider a stylized example: Assume the home country produces beer and the foreign country produces wine. If you want to exchange a beer for wine, the relative price indicates the amount of beer you need to provide in order to receive a unit of wine (in direct quotation) or the quantity of wine you will receive for a unit of beer (in indirect quotation).
For example, a relative price of 1 means you can exchange 1 liter of beer for 1 liter of wine. However, if we assume that beer is measured in 500 ml cans and wine in 1-liter bottles, the relative price denoted with \(P^{\frac{beer}{wine}}\) would be represented as:
\[P^{\frac{beer}{wine}}= \frac{2 \text{ cans of beer}}{1 \text{ bottle of wine}}.\]
This means you can exchange 2 cans of beer for one bottle of wine.
If the relative price increases, you will need to provide more beer to receive a bottle of wine. Conversely, if the relative price decreases, you will need to provide less beer to obtain a bottle of wine.
Relative prices determine the relative price of commodities across countries. For example, an increase in the price of foreign commodities makes imported commodities relatively more expensive and home commodities relatively cheaper for buyers at home.
Relative prices are (directly) determined by exchange rates. To logically prove this statement, let us assume for simplicity an exchange rate of 1, \[E^{\frac{\text{₺}}{\text{€}}}=E^{\frac{\text{€}}{\text{₺}}}=1\] and that a liter of beer costs 1 € at home and a wine costs 1 ₺ abroad. Thus, we can buy both a wine or a beer for 1 €. Due to the fact that we must pay the wine producer with ₺, we must convert the € beforehand. The process goes like visualized in Figure 29.4:

Now, assume that the € appreciates and the exchange rate becomes \(E^{\frac{\text{€}}{\text{₺}}}=0.5\) and \(E^{\frac{\text{₺}}{\text{€}}}=2\), respectively. Then, you receive more than one wine if we assume that the price of wine in ₺ remains unchanged. The process is visualized in Figure 29.5:

That means, exchange rates determine the relative prices. If the home currency appreciates (depreciates), buying goods and services abroad becomes relative cheaper (more expensive).
Of course, if many people now buy wine and aim to convert € to ₺, this may impact the exchange rate and the price of wine. We come back to that later.
The exchange rate determines the relative price of commodities across countries. For example, an appreciation of a currency makes commodities more expensive for foreign buyers and in turn makes foreign commodities cheaper for buyers at home.
29.4 The importance of exchange rates
Here is an incomplete list of arguments to emphasize the importance of exchange rates for economies, businesses, and individuals:
- Import/export costs: Exchange rate fluctuations determine the relative prices and hence affect the cost of importing goods and materials and the global demand for domestic products. An appreciation of the home currency makes imports relatively cheaper but exports more expensive for the rest of the world, while depreciation has the opposite effect.
- Revenue conversion: Multinational companies earn revenues in multiple currencies. Exchange rate changes can significantly impact the value of these revenues when converted back to the home currency, affecting overall profitability.
- Foreign investments: Companies investing in foreign assets or operations need to understand exchange rates to forecast returns accurately and manage exchange rate risk.
- Risk management: Knowledge of exchange rates enables businesses to hedge against currency risk using financial instruments like forwards, futures, options, and swaps. This is crucial for stabilizing cash flows and protecting profit margins.
- Market competitiveness: Exchange rates affect the relative cost competitiveness of goods and services in international markets. Companies need to understand these implications to price their products competitively and make strategic decisions about entering or exiting markets.
- Macroeconomic insights: Exchange rates are influenced by and also affect economic indicators such as inflation, interest rates, and economic growth. Understanding these relationships helps in making informed predictions about market conditions.
- Contractual agreements: Businesses engaged in international trade must understand exchange rates to negotiate and structure contracts effectively, determining terms such as the currency of payment and exchange rate clauses.
- Government and Policy Understanding: Exchange rates are often influenced by governmental and central bank policies. Understanding the dynamics between exchange rates and policy decisions is vital for anticipating regulatory changes and their potential impact on business operations.
29.5 Trump, relative prices, and trade policy
Let’s return to Trump’s Twitter message . Steel producers in the U.S. (and Donald Trump himself) are unhappy about a strong dollar (and a weak Turkish Lira) because it makes their products relatively expensive for Turkish buyers while making Turkish steel relatively cheap for U.S. consumers.
Trump had two options to address this issue: altering the exchange rates or adjusting the relative prices of goods between countries. Changing the exchange rate directly is a challenging task. Although buying or selling currencies on the foreign exchange market can influence exchange rates, the market is so large that the actions Trump could take as President would have minimal impact (see Section 29.6). Adjusting policy rates could influence exchange rates more effectively, as we will discuss in Chapter 30. However, the Federal Reserve, which sets policy rates and thus has an impact on interest rates, operates independently from political orders. Consequently, Trump’s influence over their decisions is limited.
As a result, Trump chose to increase the price of foreign steel in the U.S. by introducing or raising tariffs. The approach works, American steel producing companies get protected from foreign competition and might sell more domestically. However, there many negative consequences that detoriate the overall welfare. Foremost, everybody in the U.S. must pay more for steel (and for products made with steel and aluminum). David Boaz, Executive Vice President of the Cato Institute, a libertarian think tank, highlights this issue in his response on Twitter (see Figure 29.6).

Source: Twitter
To quantify the costs of Mr. Trumps’s tariffs, let me quote the well-written article by Amiti et al. (2019) (p. 188-189):
In addition, it can be argued that increased tariffs might actually make the dollar stronger. If buyers stop purchasing steel from Turkey due to higher tariffs, they will need fewer Turkish lira and therefore will exchange fewer U.S. dollars for Turkish lira. This reduced demand for Turkish lira could lead to a stronger dollar.
While raising tariffs and initiating trade disputes could be a strategy to gain political support and possibly get re-elected, there is a general consensus among economists that raising tariffs usually leads to economic losses and detrimental outcomes for all countries involved.
29.6 The FOREX
29.6.1 The market
In a market, individuals exchange goods and services, offering something to receive something else in return. In the FOREX (foreign exchange market), participants exchange currencies. Like all markets, the price here is influenced by the supply and demand dynamics of currencies.
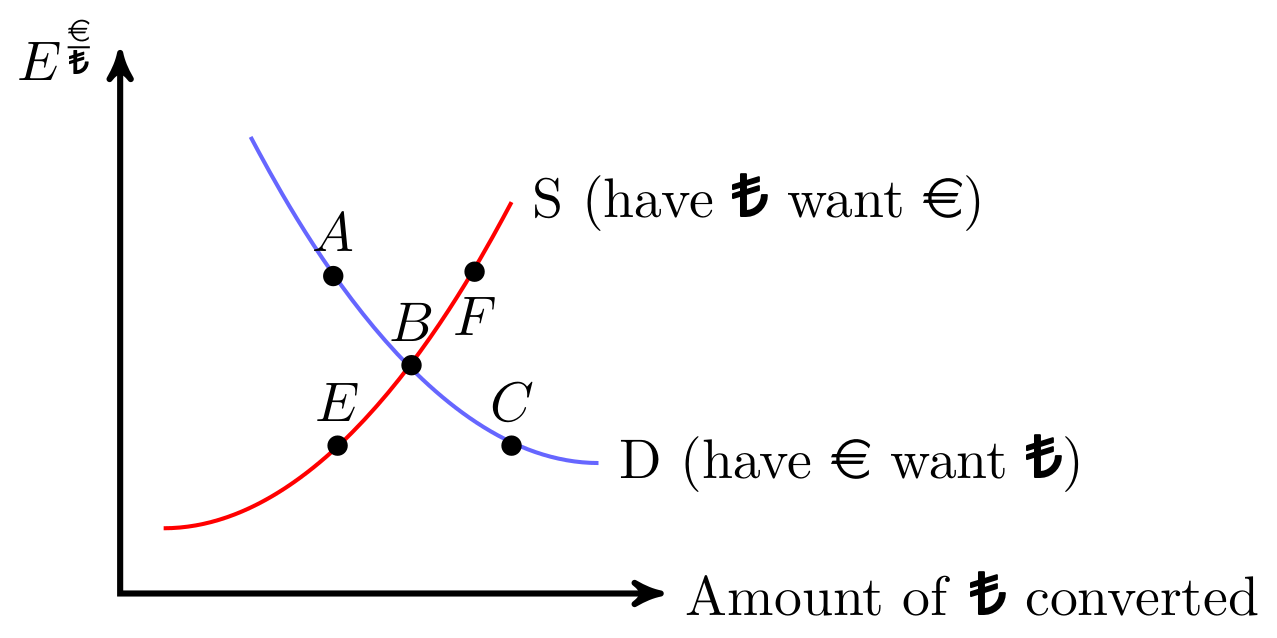
- When the Euro (€) is considered strong, the exchange rate \(E^{\frac{\text{€}}{\text{₺}}}\) is low:
- At this lower exchange rate, there’s a high demand for Turkish Lira (₺) (point C), but the supply of ₺ is scarce (point E).
- Consequently, the Euro faces depreciation pressure, leading to an increase in the exchange rate \(E^{\frac{\text{€}}{\text{₺}}} \uparrow\).
- Conversely, when the Euro (€) is weak, the exchange rate \(E^{\frac{\text{€}}{\text{₺}}}\) is high:
- With the exchange rate high, the demand for ₺ drops (point A), while its supply burgeons (point F).
- As a result, the Euro is under appreciation pressure, causing the exchange rate to decrease \(E^{\frac{\text{€}}{\text{₺}}} \downarrow\).
- Point B represents the equilibrium exchange rate, where the demand for ₺ meets its supply. At this juncture, holders of ₺ are unwilling to part with more, and similarly, Euro holders are not inclined to exchange more.
In 2022, the daily (!) traded volume of currencies averaged approximately $ 7,506 billion, as highlighted in Table 29.1.
| name | 2001 | 2004 | 2007 | 2010 | 2013 | 2016 | 2019 | 2022 |
|---|---|---|---|---|---|---|---|---|
| Total | 1.239 | 1.934 | 3.324 | 3.973 | 5.357 | 5.066 | 6.581 | 7.506 |
| USD | 1.114 | 1.702 | 2.845 | 3.371 | 4.662 | 4.437 | 5.811 | 6.639 |
| EUR | 470 | 724 | 1.231 | 1.551 | 1.790 | 1.590 | 2.126 | 2.292 |
| JPY | 292 | 403 | 573 | 754 | 1.235 | 1.096 | 1.108 | 1.253 |
| GBP | 162 | 319 | 494 | 512 | 633 | 649 | 843 | 968 |
| CNY | 0 | 2 | 15 | 34 | 120 | 202 | 285 | 526 |
| AUD | 54 | 116 | 220 | 301 | 463 | 349 | 446 | 479 |
| CAD | 56 | 81 | 143 | 210 | 244 | 260 | 332 | 466 |
| CHF | 74 | 117 | 227 | 250 | 276 | 243 | 326 | 390 |
| All others combined | 170 | 251 | 568 | 786 | 1124 | 1223 | 1921 | 2093 |
Note: All others combined are: HKD, SGD, SEK, KRW, NOK, NZD, INR, MXN, TWD, ZAR, BRL, DKK, PLN, THB, ILS, IDR, CZK, AED, TRY, HUF, CLP, SAR, PHP, MYR.
Source: https://github.com/TheEconomist/big-mac-data (July 18, 2018).
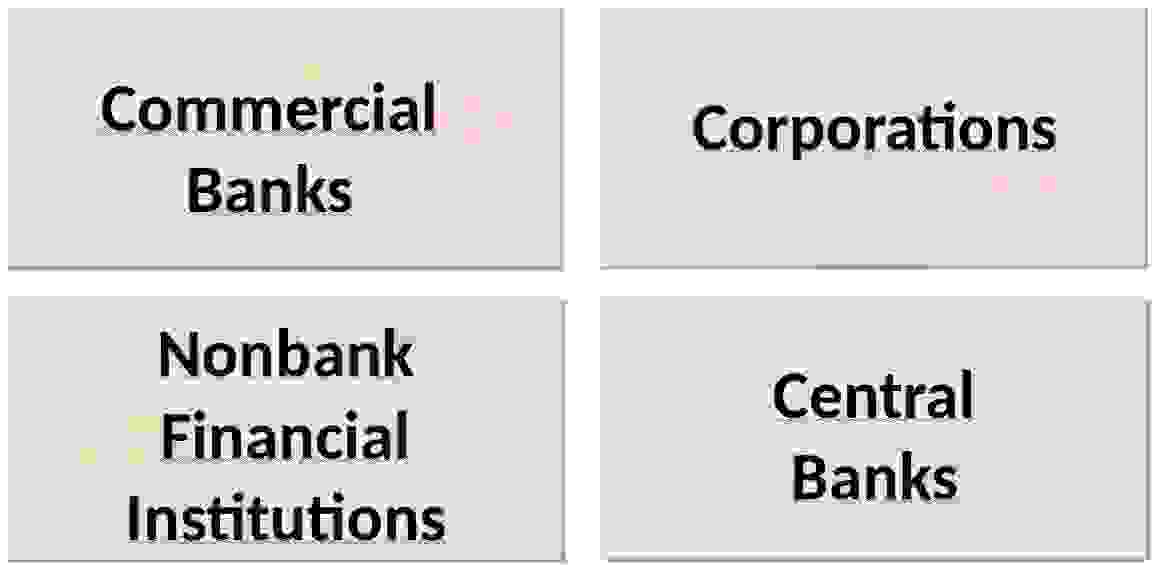
29.6.2 Actors on the FOREX
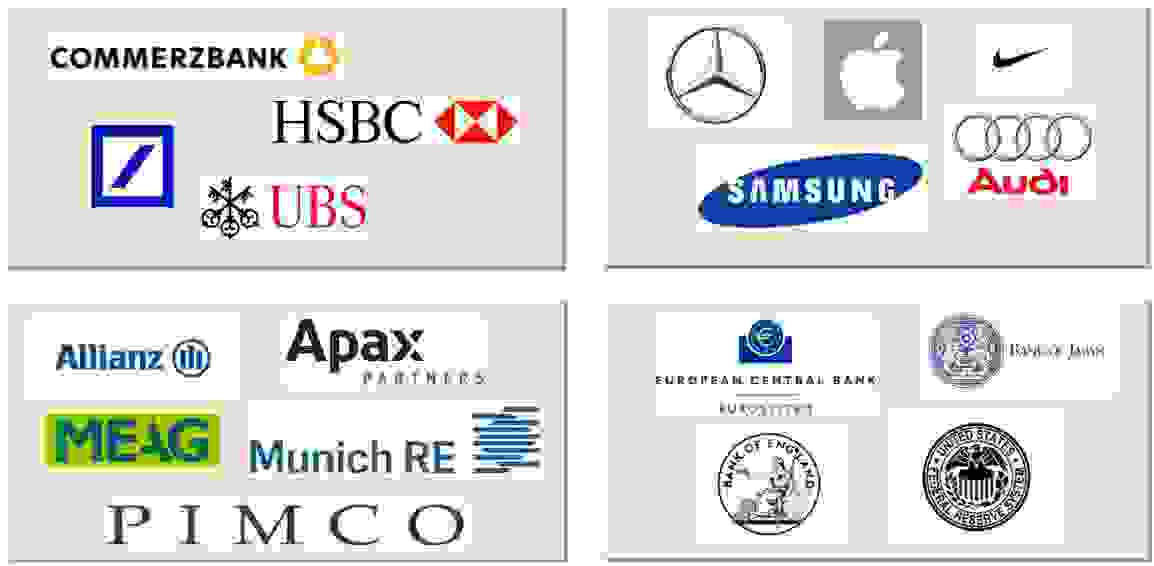
As indicated in Figure 29.8, there are several major players involved in trading on the foreign exchange market. In particular, commercial banks, multinational corporations and non-bank financial institutions, such as investment funds, play an important role in trading and speculation. Central banks also play a crucial role as they intervene to stabilize their national currency and thus influence the direction of the market.
29.6.3 The vehicle currency
Instead of converting directly between two less common currencies, it’s more efficient to use a broadly accepted and stable currency as a vehicle. That means, if you want to exchange currency A to B. You do not exchange currency A directly to B but you convert currency A first to the vehicle currency C and then from C to B.
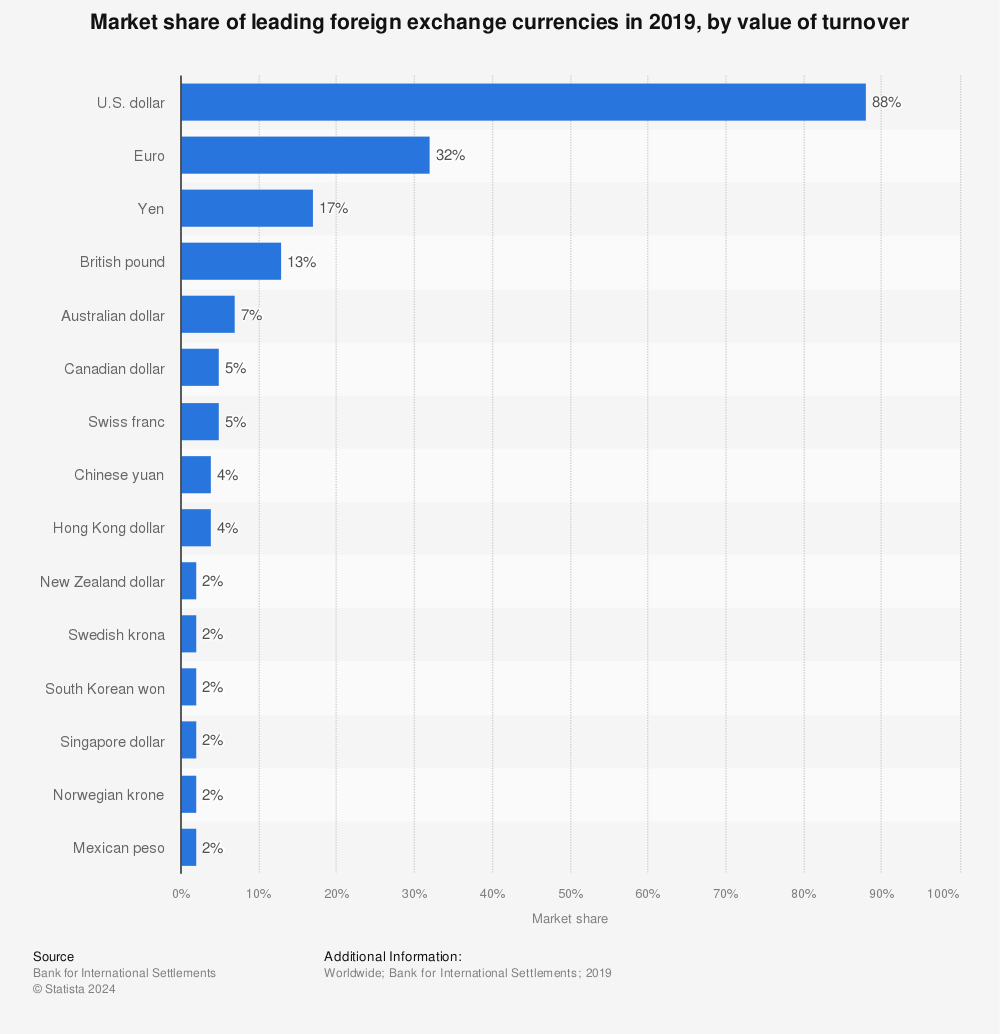
As depicted in Figure 29.9, around 32% of all currency transactions included the Euro while a notable 88% involved the U.S. Dollar which makes the Dollar the standard vehicle currency. The Dollar acts as a medium in transactions between currencies that do not directly trade with high volume. This can reduce transaction costs and streamline the process.
29.7 Purchasing power parity assumption
The Purchasing Power Parity (PPP) assumption is also know as the law of one price. It says that in competitive markets with zero transportation costs and no trade barriers, identical goods have the same price all over the world when expressed in terms of the same currency. The idea behind this is that if differences in prices exist, profits can be made through international arbitrage, that is, the process of buying a good cheap in one country and selling the good with a profit in another country. This process can quickly equalize real price differences across countries.
However, in the real world, prices differ substantially across countries (see the Big Mac Index in Table 29.2 and Exercise 29.5). The assumptions of the PPP do mostly not hold perfectly in reality: some goods and services are not trade-able, firms might have different degrees of market power across countries, and the transaction costs are not zero. Here are more reasons, why the PPP does not always apply, especially in the short run:
- Transportation costs are not zero. Shipping goods can be time consuming and expensive.
- Many goods and services, such as real estate or personal services, cannot be traded.
- International markets may be segmented due to regulatory barriers, tariffs and other trade restrictions.
- Countries have different consumption preferences. That means, the same basket of goods is not necessarily equally demanded. The willingness to pay for goods vary across countries often significantly.
- Countries impose different taxes and provide different subsidies on goods and services, which affects their prices and leads to deviations from PPPs.
- Short-term fluctuations in exchange rates may deviate from the values predicted by PPPs due to speculation, interest rate differentials and other factors.
- Differences in inflation rates between countries may lead to deviations from PPP, especially in the short run.
- The same product may be perceived differently in different countries due to brand names, quality differences or local customization, resulting in different prices.
- Regulations like warranty and product classifications are different and have an impact on the product and the willingness to pay for it.
- Political instability, war or economic sanctions can affect currency values and prices and lead to deviations from PPP.
- Prices of goods and services do not always adjust immediately to changes in the exchange rate, leading to short-term deviations from PPP.
Exercise 29.7 Brexit and the exchange rate
Examine Figure 29.10 and discuss the reasons behind the depreciation of the British pound since June 2016.
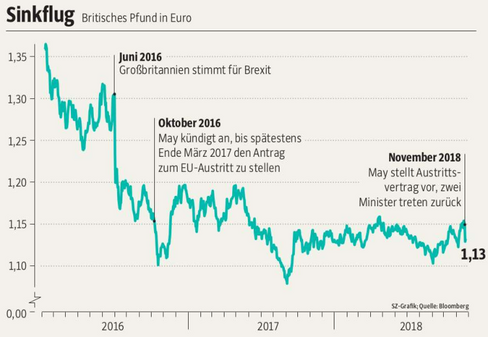
Source: Süddeutsche Zeitung am Wochenende, 17./18. November 2018, year 74, week 46, No. 265, p. 1 (front page).
The total value added of a country in a given period↩︎
The interest rate set by a central bank that influences the lending and borrowing rates of commercial banks to control inflation, manage employment levels, and stabilize the currency↩︎
The percentage increase in the general price level of goods and services in an economy over a given period↩︎