5 GDP
Required readings: Shapiro et al. (2022, ch. 19), Mankiw (2024, ch. 24)
Recommended readings: Shapiro et al. (2022, ch. 22, 23), Mankiw (2024, pt. VIII, ch. 32)
Learning objectives:
Students will be able to:
- Understand the importance of gross domestic product (GDP) and how it is measured.
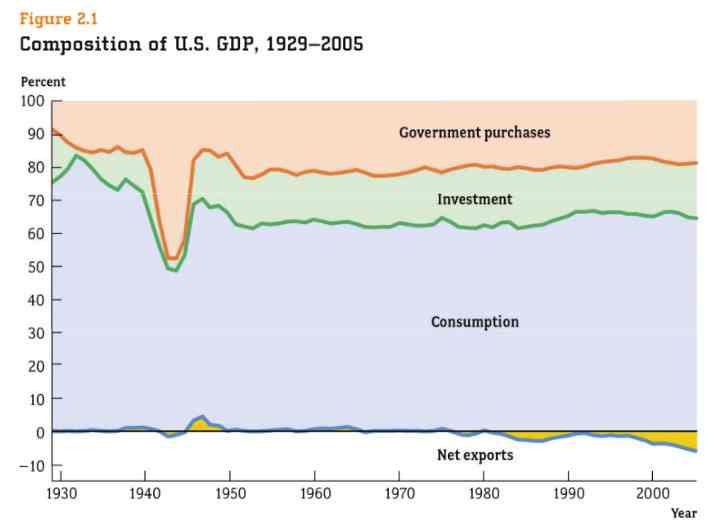
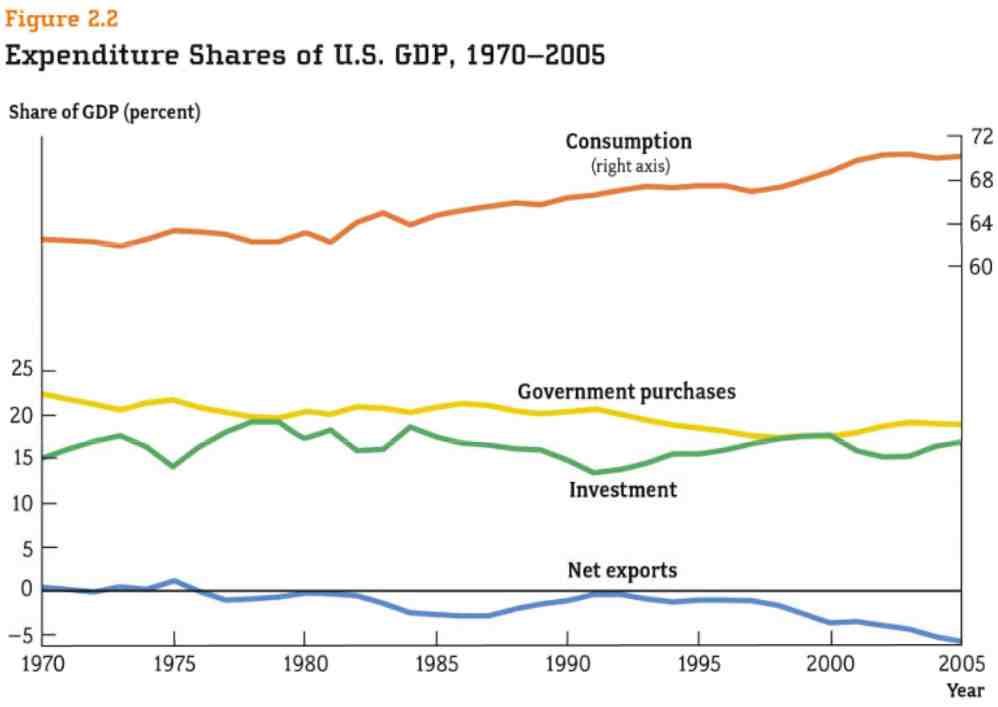
- Analyze the composition of GDP and how it has changed over time.
- Recognize that GDP is the sum of consumption, investment, government spending, inventory investment, and exports minus imports.
5.1 Gross Domestic Product (GDP)
William D. Nordhaus (2002): “While the GDP and the rest of the National Income and Product Accounts (NIPA) may seem to be arcane concepts, they are truly among the great inventions of the twentieth century. Much like a satellite in space can survey the weather across an entire continent, GDP provides an overall picture of the state of the economy. Since its initial construction by Simon Kuznets, who won the Nobel Prize in Economics for his contributions to national income accounting, significant strides have been made in developing and improving indexes of economic welfare.”
The Gross Domestic Product (GDP) “is the market value of all final goods and services produced within a country in a given period of time” (Mankiw, 2024, ch. 24).
This definition consists of four parts:
- Market value: The items in GDP are valued at their market prices.
- Final goods and services: A final good is an item purchased by its final user. It contrasts with an intermediate good, which is produced by one firm, bought by another firm, and used as a component of a final good or service. To avoid double counting, GDP includes only final goods and services.
- Produced within a country: Only goods and services produced within a country are counted.
- In a given period of time: GDP is measured over a specified time frame, typically a quarter or a year.
5.2 Three equivalent ways to measure the GDP
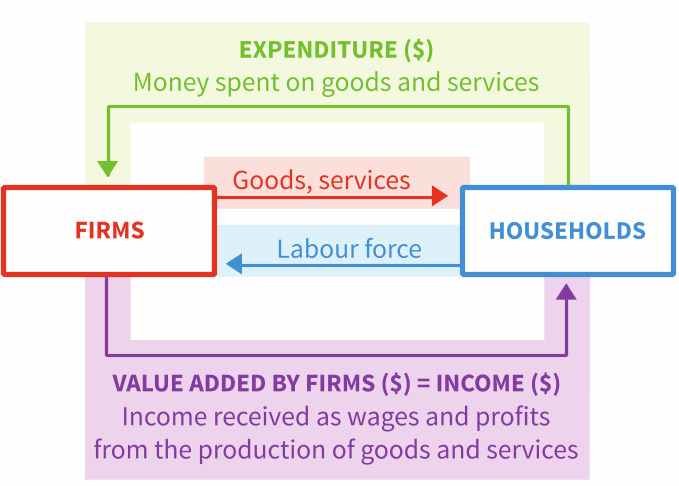
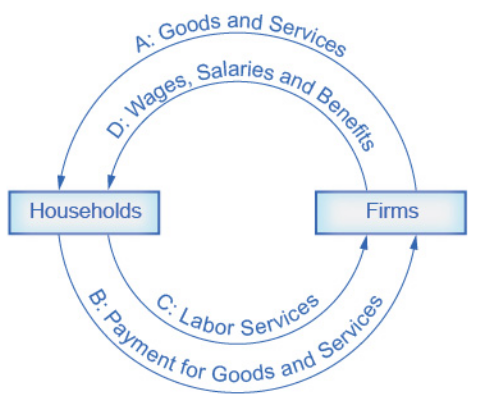
GDP can be quantified through three methods, each expected to yield equivalent outcomes. The circular flow diagrams of Figure 5.2 visualize the concept.
- Total spending on domestic products and services (expenditure approach)
- Total domestic income (income approach)
- Total domestic production (production approach)
All three approaches theoretically should arrive at the same result, that is, measuring the value that was added within an economy over the course of time.
Note: The diagram was taken from Suranovic (2016), p. 54.
Watch the videos of Figure 5.3.
Source: Youtube
5.2.1 The expenditure approach
The expenditure approach measures GDP as the sum of consumption expenditure, \(C\), investment, \(I\), government expenditure on goods and services, \(G\), and net exports of goods and services, \((X - M)\). Therefore, the equation - which is often called the GDP decomposition - is:
\[GDP = C + I + G + (X - M),\]
where
- \(C\) denote the expenditure on all consumer goods,
- \(I\) denotes the expenditure on newly produced capital goods,
- \(G\) denotes government expenditure on goods and services (excluding transfers),
- \(X\) denotes the exports, and \(M\) the imports. The difference \(X-M\) stands for the net exports, also known as the trade balance. For example, for the USA in 2020, this amounts to: \[\$14,145 + \$3,605 + \$3,831 + (-\$645) = \$20,936.\] Aggregate expenditure equals GDP because all goods and services produced are sold to households, firms, governments, or foreigners. Please note, goods and services that are not sold are included in investment as inventories and thus are “sold” to the producing firm.
Please consider Figures Figure 5.4, Figure 5.5, and Figure 5.6. They illustrate various aspects of GDP composition.
Source: World Bank (2015). Adapted from Core Economics
Source: Jones (2008)
Source: Jones (2008)
5.2.2 The income approach
The income approach measures GDP as the sum of compensation of employees, net interest, rental income, corporate profits, and proprietors’ income. This sum equals net domestic income at factor costs. To obtain GDP, indirect taxes (taxes paid by consumers when they buy goods and services) minus subsidies are included along with depreciation. Finally, any discrepancy between the expenditure approach and the income approach is included in the income approach as a statistical discrepancy.
5.2.3 The production approach
The production approach calculates how much value is contributed at each stage of production. (Gross value added = gross value of output - value of intermediate consumption.)
5.3 Limitations of the nominal GDP
Source: Public domain taken from Wikipedia (2025)
The GDP as a single measure for economic activity and production, respectively, was pioneered and developed by a Russian-born American economist, Simon Kuznets (1901-1985), see Figure 5.7. He received the Nobel Prize in economics in 1971 for his contributions. While he was convinced about the valuable uses of national income measurements, he was very much aware of the limitations and the risks of the measures to be abused. In an report to the U.S. Senate where he explains the possibilities of a national income measure, he warns in the section “Uses and Abuses of National Income Measurements” (Kuznets, 1934, pp. 5–8) that the GDP needs to be “interpreted with a full realization of the definition of national income assumed”Kuznets (1934, p. 6). Otherwise it is abused. Please read here his carefull warning:
“The valuable capacity of the human mind to simplify a complex situation in a compact characterization becomes dangerous when not controlled in terms of definitely stated criteria. With quantitative measurements especially, the definiteness of the result suggests, often misleadingly, a precision and simplicity in the outlines of the object measured. Measurements of national income are subject to this type of illusion and resulting abuse, especially since they deal with matters that are the center of conflict of opposing social groups where the effectiveness of an argument is often contingent upon oversimplification.
From the definition of national income presented and discussed above it is obvious that a measure of income produced sheds a good deal of light on the productivity of the nation; that income received measures the same productivity as reflected in the flow of means of purchase to the nation’s members; and that when total income paid out is adjusted for changes in the value of money and apportioned per capita, the result is illuminating of movements in the nation’s economic welfare. Comparison of such income measurements for different nations, or for the same nation for different years, yields valuable indications of spatial and temporal differences in national productivity and economic welfare. Moreover, various single groups of services or drafts may be compared with the country’s total to indicate their relative weight in or draft upon the latter.
These constitute highly valuable uses of national income measurements, but only if the results are interpreted with a full realization of the definition of national income assumed, either explicitly or implicitly, by the measurement. Thus, the estimates submitted in the present study define income in such a way as to cover primarily only efforts whose results appear on the market place of our economy. A student of social affairs who is interested in the total productivity of the nation, including those efforts which, like housewives’ services, do not appear on the market, can therefore use our measures only with some qualifications. Secondly, the present study’s measures of national income, like all such studies, estimates the value of commodities and direct services at their market price. But market valuation of commodities and especially of direct services depends upon the personal distribution of income within the nation. Thus in a nation with a rich upper class, the personal services to the rich are likely to be valued at a much higher level than the very same services in another nation, characterized by a more equitable personal distribution of income. A student of social affairs who conceives of a nation’s end-product as undistorted by the existing distribution of income, yould again have to qualify and change our estimates, possibly in a marked fashion. Thirdly, the present study’s estimate of national income produced is based in part, like most existing estimates, upon the prevalent legal and accounting distinction between gross and net income of business enterprises. To a student of social affairs whose concept of net productivity does not agree with the prevailing practices of separating net from gross income, especially by corporations, our estimates will obviously present a somewhat distorted picture of the nation’s net product.
All these qualifications upon estimates of national income as an index of productivity are just as important when income measurements are interpreted from the point of view of economic welfare. But in the latter case additional difficulties will be suggested to anyone who wants to penetrate below the surface of total figures and market values. Economic welfare cannot be adequately measured unless the personal distribution of income is known. And no income measurement undertakes to estimate the reverse side of income, that is, the intensity and unpleasantness of effort going into the earning of income. The welfare of a nation can, therefore, scarcely be inferred from a measurement of national income as defined above.
The abuses of national income estimates arise largely from a failure to take into account the precise definition of income and the methods of its evaluation which the estimator assumes in arriving at his final figures. Notions of productivity or welfare as understood by the user of the estimates are often read by him into the income measurement, regardless of the assumptions made by the income estimator in arriving at the figures. As a result we find all too commonly such inferences that a decline of 30 percent in the national income (in terms of “constant” dollars) means a 30 percent decline in the total productivity of the nation, and a corresponding decline in its welfare. Or that a nation whose total income is twice the size of the national income of another country is twice “as well off”, can sustain payments abroad twice as large or can carry a debt burden double in size. Such statements can obviously be true only when gualified by a host of “ifs.”
A similar failure to take into account the investigator’s basic assumptions underlies another widely prevalent abuse of national income measures, involved in estimating the draft or “burden” which this or that particular type of expenses (e.g., government expenses, payments on bonded debt, etc.) constitutes ot the country’s total end-product. Every payment included in the national income is ipso facto a draft or a “burden” upon national income. For example, net receipts by physicians from medical practice, are both an addition to national income and a draft upon individual incomes from which such receipts originate. Since we estimate the value of personal services or commodities at their market value it follows that any payment for productive services contributes just as much to the national income total as it takes away from it. No items included in national income can, therefore, be conceived as “pure” draft.
The full meaning of a statement that such payments as interest on bonds or taxes for government services are a ” burden” or draft upon national income is that actually no services are being rendered in return for these payments. That an increasing weight in the national income of payments on fixed debt or of salaries of government officials is not hailed as an increased contribution to national income lies in the implicit assumption, not always true, that the services contributed by creditors or government officials have not increased proportionately, and that, therefore, a heavier burden was added upon other income recipients without an increased benefit.
Such assumptions are accepted all too easily because they are based upon a natural but erroneous identification of national income with business or personal income. From the standpoint of a business firm or person, the income of employees, private or public, is likely to appear as a draft. But from the vantage point of national economy as a whole, which is used by a national income investigator, no payment that is included in national income can be considered as a pure draft upon the country’s end-product. This can be true only of payments not included, such as charity, earnings from illegal pursuits, and the like. All that the national income estimator can say is that this or the other part of the national total has increased or declined more than the others. That this rise or decline implies a larger or smaller burden upon the national economy can be established only on the basis of such additional assumptions as have been formulated above, assumptions which arc not a proper part of the national income estimate and which are far from being self-evident.”
In a nutshell, GDP is an imperfect measure of production as it overlooks significant parts of economic activity. For example, it does not account for black market activity, private production, and production that occurs outside formal markets. While GDP is often used to gauge a country’s welfare or the well-being and happiness of its citizens, it neglects factors considered essential to these concepts, which are inherently difficult to define.
5.4 Nominal and real GDP
Please watch the video of Figure 5.8.
Source: Youtube
Nominal GDP reflects the value of final goods and services produced in a specific year, valued at the prices prevalent during that year. The overall market value of production and thus GDP can rise either through increased output of goods and services or through higher prices. In contrast, the real GDP enables the comparison of production quantities across different time periods, as it represents the value of final goods and services produced in a year, valued at the prices of a reference base year. This relationship is expressed as:
\[GDP^{\text{real}}=\frac{GDP^{\text{nominal}}}{P}\]
While nominal GDP is the commonly reported figure and does not account for price adjustments, real GDP provides somehow a more accurate reflection of the actual quantity of goods and services produced. The real GDP is an inflation-adjusted measure that captures the value of all goods and services produced by an economy in a given year, expressed in base-year prices. It is often referred to as constant-price GDP, inflation-corrected GDP, or constant dollar GDP. A clear definition can be found on Wikipedia (2020):
“Real gross domestic product (real gdp for short) is a macroeconomic measure of the value of economic output adjusted for price changes (i.e., inflation or deflation). This adjustment transforms the money-value measure, nominal GDP, into an index for quantity of total output.”
To clarify the concept of the real GDP, consider the two following examples where we suppose the economy produces only one product.
The examples above simplify reality by assuming that only one item is being produced in the economy, while, in fact, many goods and services are produced. Despite this limitation, the examples illustrate two important points. First, it is crucial to identify a representative basket of goods produced in an economy. Second, it is essential to measure the prices of this basket accurately. Both of these aspects will be discussed in Chapter 6. Afterward, we will return to evaluating GDP as a measure of welfare in Chapter 7.


