27 Aggregate supply and demand
This chapter discusses the AS-AD model.
Recommended videos:
27.1 Economic shocks and consequences
The first lockdown on March 23, 2020 was a shock, see Figure 27.1.


An economic shock is “an unexpected or unpredictable event that affects an economy, either positively or negatively. Technically, it is an unpredictable change in exogenous factors—that is, factors unexplained by an economic model—that may influence endogenous economic variables.” (Wikipedia, 2025)
Various economic effects include:
- GDP decreased by 4.9%: Economic output declined significantly in 2020.
- Deficit ratio reached 4.2%: Second-highest government deficit since German unification.
- Air passengers decreased by 74.5%: Lowest figure post-German unification.
- Consumer spending by private households fell by 4.6%: Sharpest decline in decades.
- Online retail sales surged by 27.8% since pandemic outbreak.
- 0% population growth in Germany: First since 2011.
- Foreign university entrants reduced by 21% in 2020 academic year.
- Real wages decreased by 1.1%: Sharpest decline since record-keeping began.
- Traffic fatalities dropped by 10.7%: Lowest level in nearly 70 years.
- Electricity from renewable sources reached 47%: A record high.
Source: Destatis (2021), also see here and here


During the Corona crisis, various markets experienced significant shifts. Let us consider the Gross Domestic Product (GDP) and the price level over time in Figure 27.3.
The GDP indicates the total value of all goods and services produced as final goods and services within the national borders of an economy during one year, after deduction of all intermediate consumption.
The price level is an economic indicator that shows how many monetary units must be paid in an economy for the prices of certain goods and services in a basket of goods.
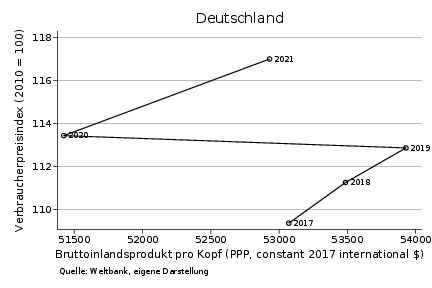
How did GDP fall while keeping price levels roughly constant?
- Less buying/selling: Value added decreased.
- Why? Was there less demand or fewer offerings? For example, were reduced hospitality sales due to fewer guests (demand down), business closures (supply down), or both?
- Apart from anecdotal evidence, assessing all effects empirically can be challenging. Typically, only price and successfully demanded quantity can be observed.
- Solution: Use theory: AS-AD Model.
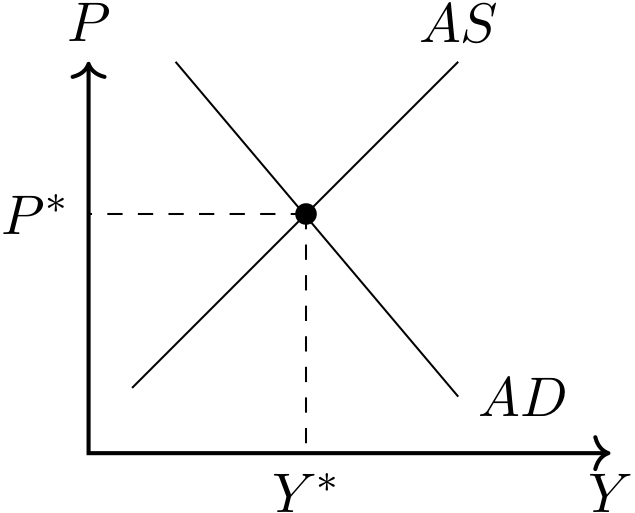
General equilibrium
Supply and demand interplay determines market equilibrium, see Figure 27.4.
27.2 Aggregated Demand (AD)
The AD curve represents total goods demand by everyone for goods and services as a function of the price level within a given period.
- Aggregate demand equals the sum of:
- Consumer goods demand (\(C\))
- Investments (\(I\))
- Government expenditure (\(G\))
- Net exports (\(NEX\) = demand from abroad \(EX\) minus domestic demand for foreign goods \(IM\))
\[ Y^D = C + G + I + \underbrace{EX - IM}_{NEX}\]
- As prices rise, demand falls (ceteris paribus).
- If \(Y^D\) decreases (and \(P\) remains constant), the curve shifts left, see Figure 27.5.
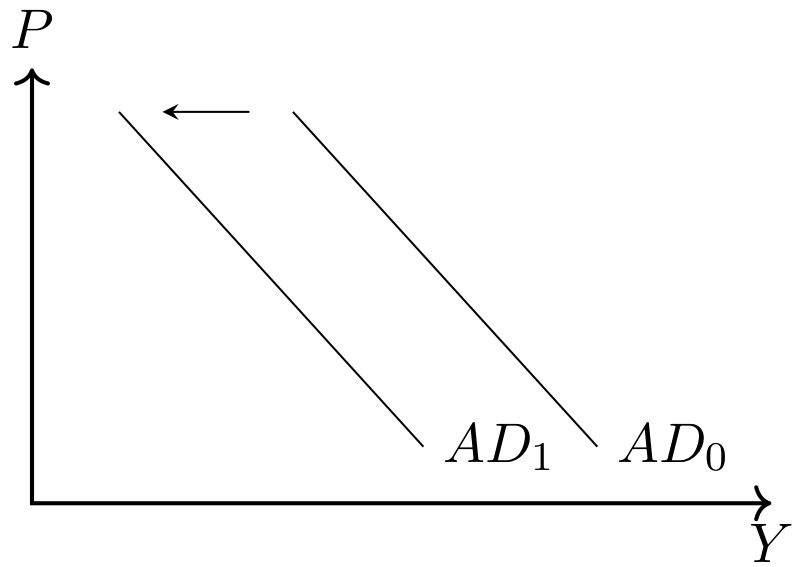
During the first lockdown in Germany, consumer goods demand and net exports fell. Government demand and demand for capital goods remained virtually unchanged.
27.3 Aggregated Supply (AS)
The AS curve depicts the value of goods suppliers can provide within a given period, depending on the price level. Supply usually increases with prices.
Supply usually increases with prices and the first lockdown certainly caused a leftward shift in the AS curve, see Figure 27.7.
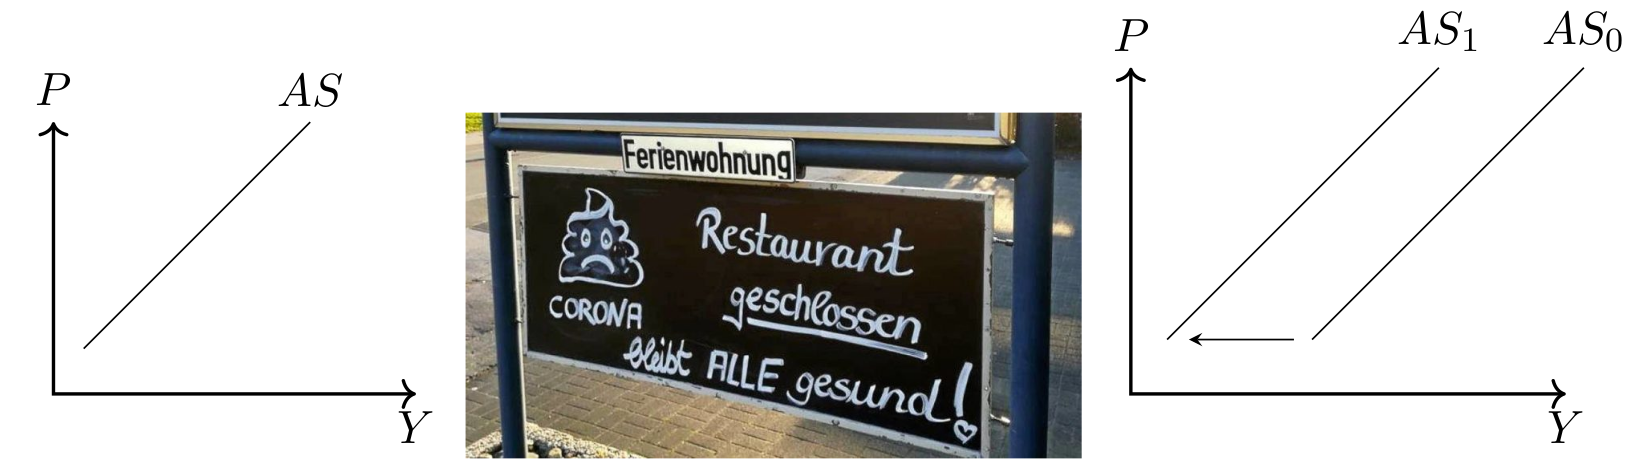
Supply Factors:
- Resources (input prices/availability): Impacted by pandemic, war, disasters, politics.
- Regulation: Impacted by taxes, laws, subsidies.
- Labor costs: Impacted by unions, minimum wages, taxes.
- Productivity: Impacted by technology, R&D, management practices.
AS-curve: The lockdown likely raised production costs (precaution measures), disrupted resource availability, and restricted spatial mobility or events—all leading to a leftward shift in AS.
AD-curve: Diverse impacts complicate analysis: - Increased demand for select goods (hygiene products). - Government interventions elevated demand (VAT reduction, short-time allowance). - Simultaneously, demand for goods requiring spatial mobility or proximity declined sharply (tourism, automotive, restaurants).
Initially, demand-reducing effects may have dominated before stabilizing. Data suggests returning demand in Germany post-first lockdown.
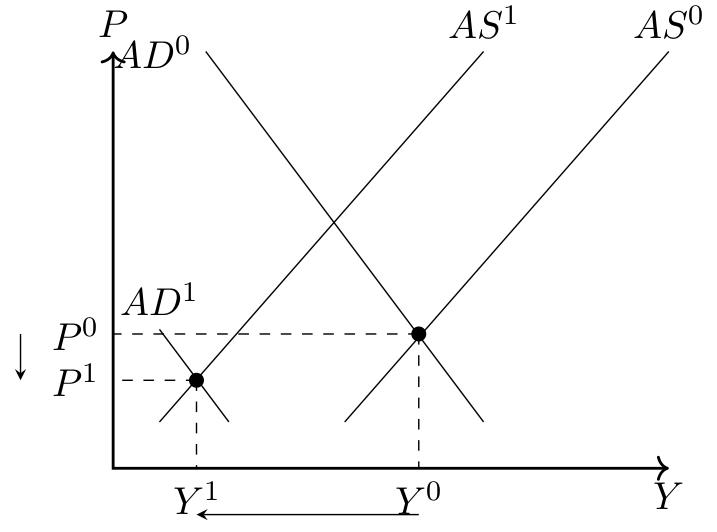
Two potential scenarios:
Scenario 1: Slight demand decrease
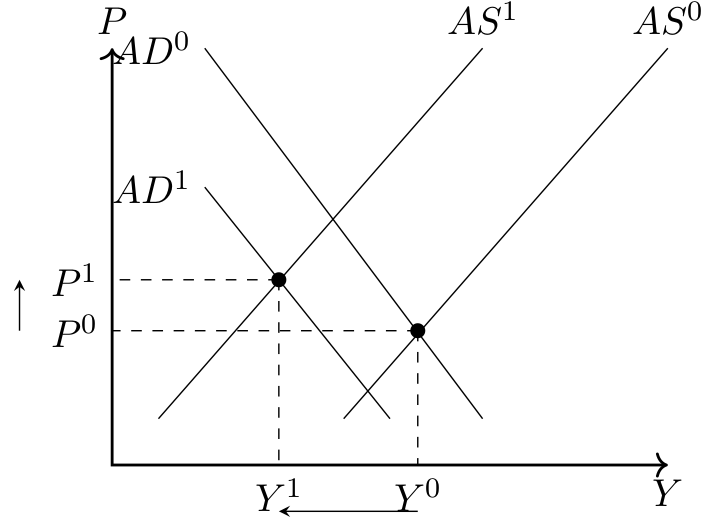
Scenario 2: Significant demand decrease
Actual case:
Figure 27.10 shows the theoretical visualization and the actual outcomes.
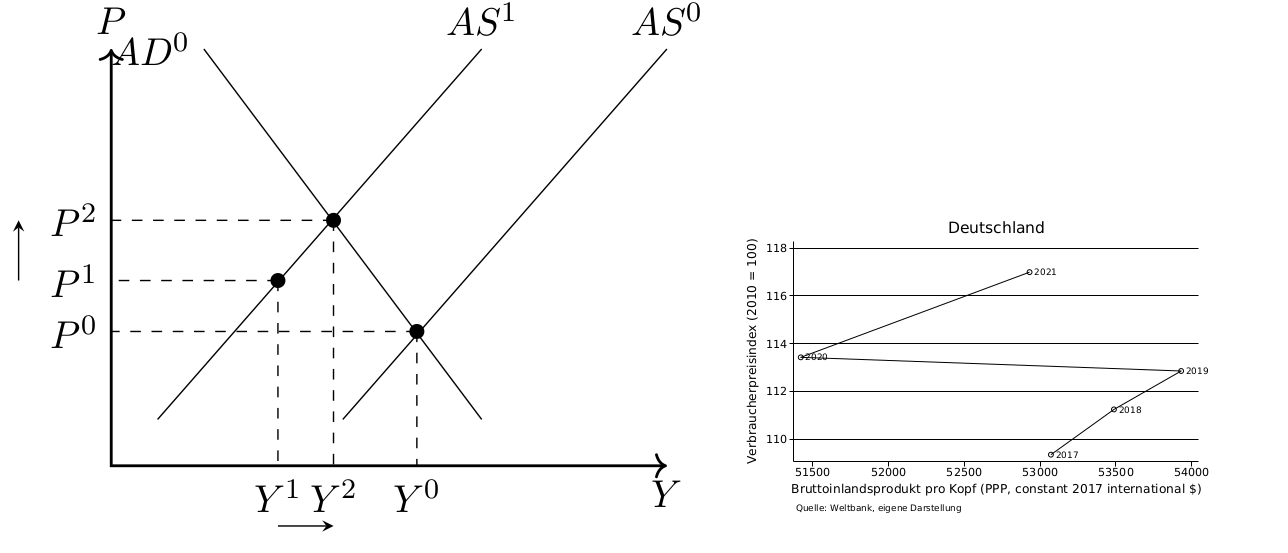
27.4 International data
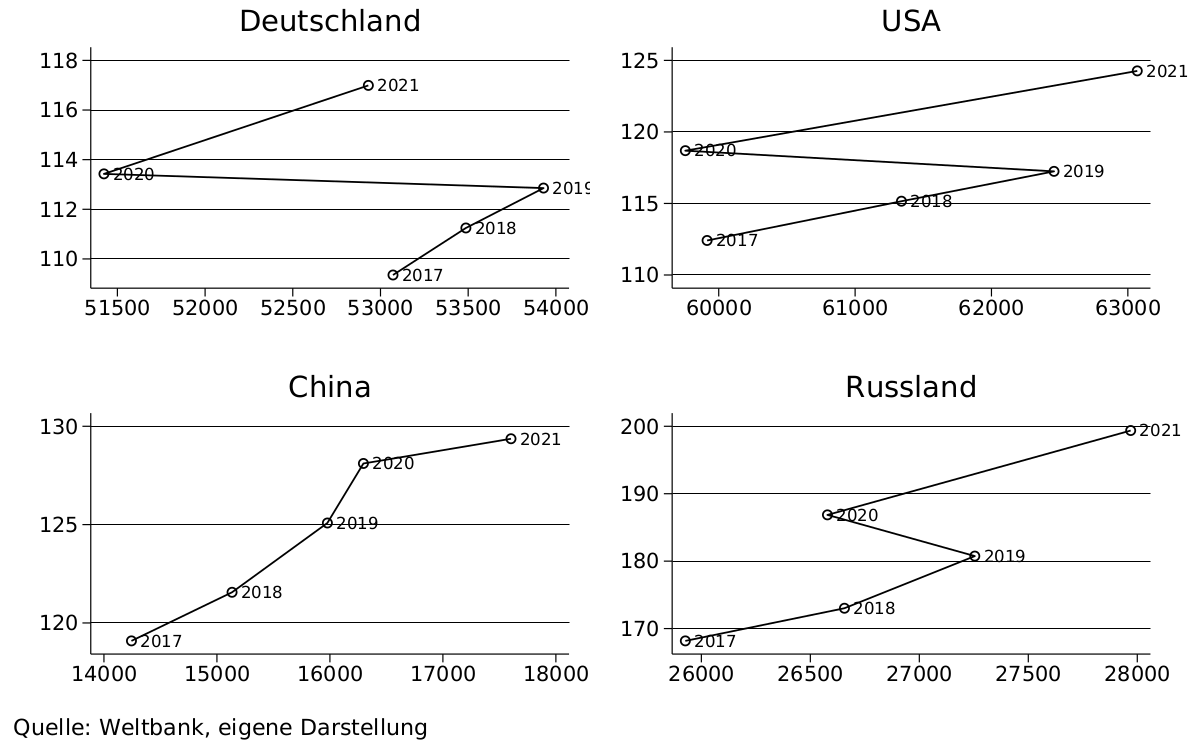
Exercise 27.3 Comparing the financial crisis to the Corona crisis
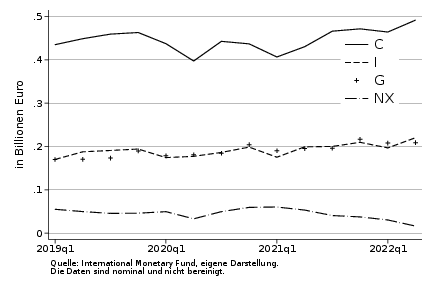
Analyze the graphs below and read BMWK: Ist Krise gleich Krise?.
Discuss differences between the 2009 financial crisis and the 2020 Corona crisis from aggregate supply and demand perspectives. Additionally, please consider Figure 27.12. Address demand components in both crises. Using the AS-AD model, explain why general price increases were mostly absent during the financial crisis despite expansionary policies, whereas prices rose during the Corona crisis.


27.5 Summary
- Aggregate demand arises from supply-demand interaction.
- Policymakers can counteract negative effects of exogenous shocks:
- Increase government spending and cut taxes to enhance consumption, investment, exports.
- Ease fears to bolster consumption and investment.
- Reduce production costs and promote productivity (short-time allowance, subsidized loans, R&D support, etc.).
The AS-AD model aids understanding, anticipating, and analyzing macroeconomic ratios.